Cajun vs Panamanian Median Female Earnings
COMPARE
Cajun
Panamanian
Median Female Earnings
Median Female Earnings Comparison
Cajuns
Panamanians
$34,034
MEDIAN FEMALE EARNINGS
0.0/ 100
METRIC RATING
327th/ 347
METRIC RANK
$39,049
MEDIAN FEMALE EARNINGS
20.6/ 100
METRIC RATING
201st/ 347
METRIC RANK
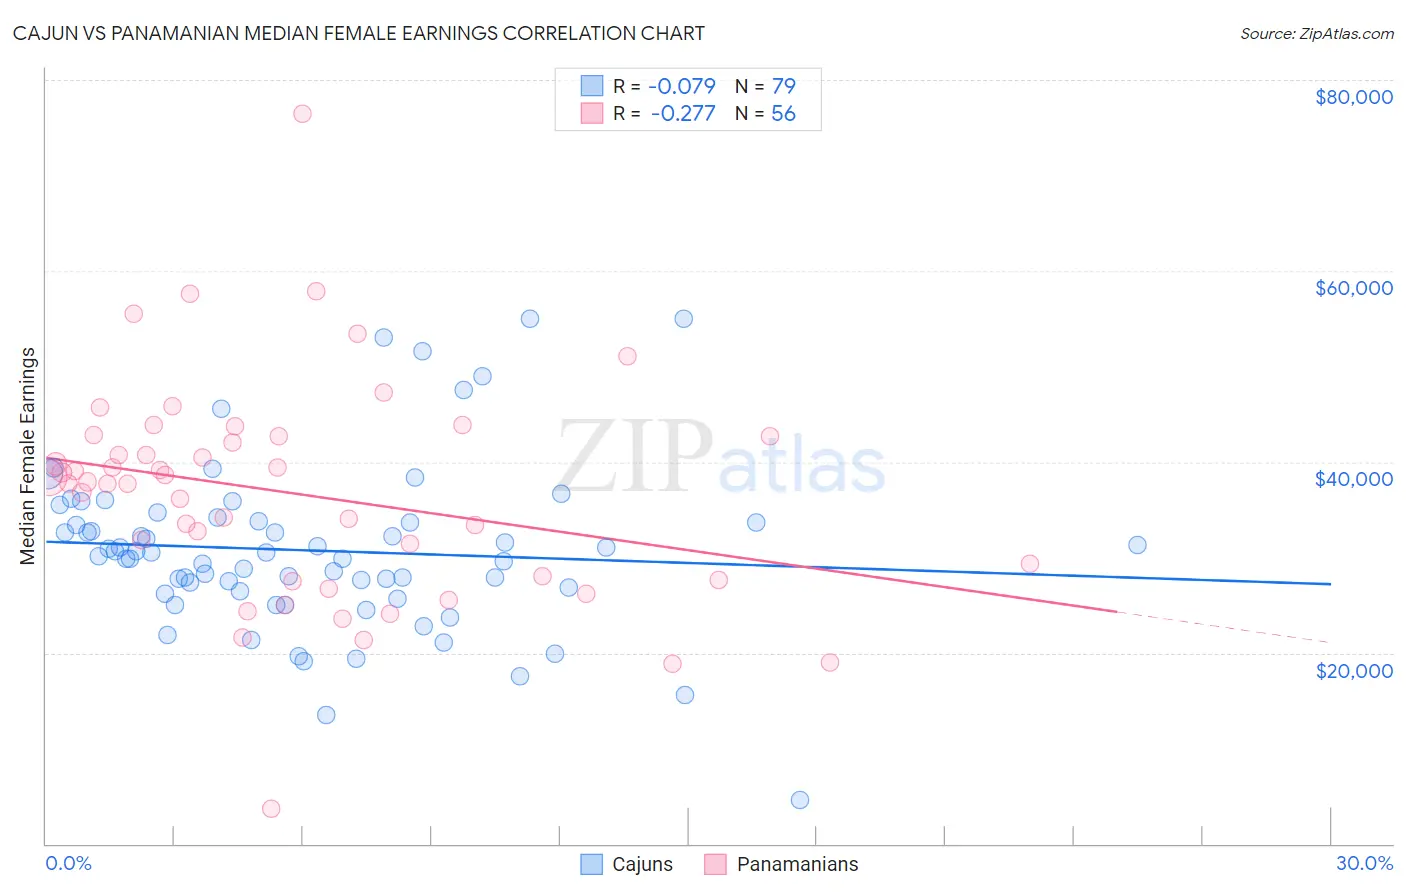
Cajun vs Panamanian Median Female Earnings Correlation Chart
The statistical analysis conducted on geographies consisting of 149,646,456 people shows a slight negative correlation between the proportion of Cajuns and median female earnings in the United States with a correlation coefficient (R) of -0.079 and weighted average of $34,034. Similarly, the statistical analysis conducted on geographies consisting of 281,178,776 people shows a weak negative correlation between the proportion of Panamanians and median female earnings in the United States with a correlation coefficient (R) of -0.277 and weighted average of $39,049, a difference of 14.7%.
Median Female Earnings Correlation Summary
| Measurement | Cajun | Panamanian |
| Minimum | $4,615 | $3,667 |
| Maximum | $55,000 | $76,443 |
| Range | $50,385 | $72,776 |
| Mean | $30,723 | $36,686 |
| Median | $30,456 | $37,828 |
| Interquartile 25% (IQ1) | $26,402 | $27,848 |
| Interquartile 75% (IQ3) | $33,785 | $42,686 |
| Interquartile Range (IQR) | $7,382 | $14,839 |
| Standard Deviation (Sample) | $8,808 | $11,684 |
| Standard Deviation (Population) | $8,752 | $11,579 |
Similar Demographics by Median Female Earnings
Demographics Similar to Cajuns by Median Female Earnings
In terms of median female earnings, the demographic groups most similar to Cajuns are Kiowa ($34,074, a difference of 0.12%), Dutch West Indian ($34,106, a difference of 0.21%), Immigrants from Central America ($33,953, a difference of 0.24%), Hopi ($33,932, a difference of 0.30%), and Menominee ($33,894, a difference of 0.41%).
| Demographics | Rating | Rank | Median Female Earnings |
| Immigrants | Honduras | 0.0 /100 | #320 | Tragic $34,647 |
| Hispanics or Latinos | 0.0 /100 | #321 | Tragic $34,421 |
| Chickasaw | 0.0 /100 | #322 | Tragic $34,414 |
| Seminole | 0.0 /100 | #323 | Tragic $34,385 |
| Immigrants | Congo | 0.0 /100 | #324 | Tragic $34,317 |
| Dutch West Indians | 0.0 /100 | #325 | Tragic $34,106 |
| Kiowa | 0.0 /100 | #326 | Tragic $34,074 |
| Cajuns | 0.0 /100 | #327 | Tragic $34,034 |
| Immigrants | Central America | 0.0 /100 | #328 | Tragic $33,953 |
| Hopi | 0.0 /100 | #329 | Tragic $33,932 |
| Menominee | 0.0 /100 | #330 | Tragic $33,894 |
| Natives/Alaskans | 0.0 /100 | #331 | Tragic $33,806 |
| Choctaw | 0.0 /100 | #332 | Tragic $33,775 |
| Mexicans | 0.0 /100 | #333 | Tragic $33,664 |
| Spanish American Indians | 0.0 /100 | #334 | Tragic $33,625 |
Demographics Similar to Panamanians by Median Female Earnings
In terms of median female earnings, the demographic groups most similar to Panamanians are Immigrants from Panama ($39,049, a difference of 0.0%), Slovak ($39,029, a difference of 0.050%), Icelander ($39,109, a difference of 0.15%), Czech ($38,992, a difference of 0.15%), and Ecuadorian ($39,117, a difference of 0.17%).
| Demographics | Rating | Rank | Median Female Earnings |
| Irish | 30.0 /100 | #194 | Fair $39,291 |
| Uruguayans | 27.3 /100 | #195 | Fair $39,228 |
| Immigrants | Costa Rica | 25.6 /100 | #196 | Fair $39,186 |
| Assyrians/Chaldeans/Syriacs | 24.6 /100 | #197 | Fair $39,159 |
| Ecuadorians | 23.0 /100 | #198 | Fair $39,117 |
| Icelanders | 22.7 /100 | #199 | Fair $39,109 |
| Immigrants | Panama | 20.6 /100 | #200 | Fair $39,049 |
| Panamanians | 20.6 /100 | #201 | Fair $39,049 |
| Slovaks | 19.9 /100 | #202 | Poor $39,029 |
| Czechs | 18.7 /100 | #203 | Poor $38,992 |
| Immigrants | Uruguay | 17.3 /100 | #204 | Poor $38,945 |
| Immigrants | Colombia | 16.3 /100 | #205 | Poor $38,913 |
| Immigrants | Bosnia and Herzegovina | 15.6 /100 | #206 | Poor $38,886 |
| Immigrants | Cambodia | 14.2 /100 | #207 | Poor $38,833 |
| Immigrants | Thailand | 13.6 /100 | #208 | Poor $38,810 |