Cajun vs Thai Median Female Earnings
COMPARE
Cajun
Thai
Median Female Earnings
Median Female Earnings Comparison
Cajuns
Thais
$34,034
MEDIAN FEMALE EARNINGS
0.0/ 100
METRIC RATING
327th/ 347
METRIC RANK
$47,577
MEDIAN FEMALE EARNINGS
100.0/ 100
METRIC RATING
7th/ 347
METRIC RANK
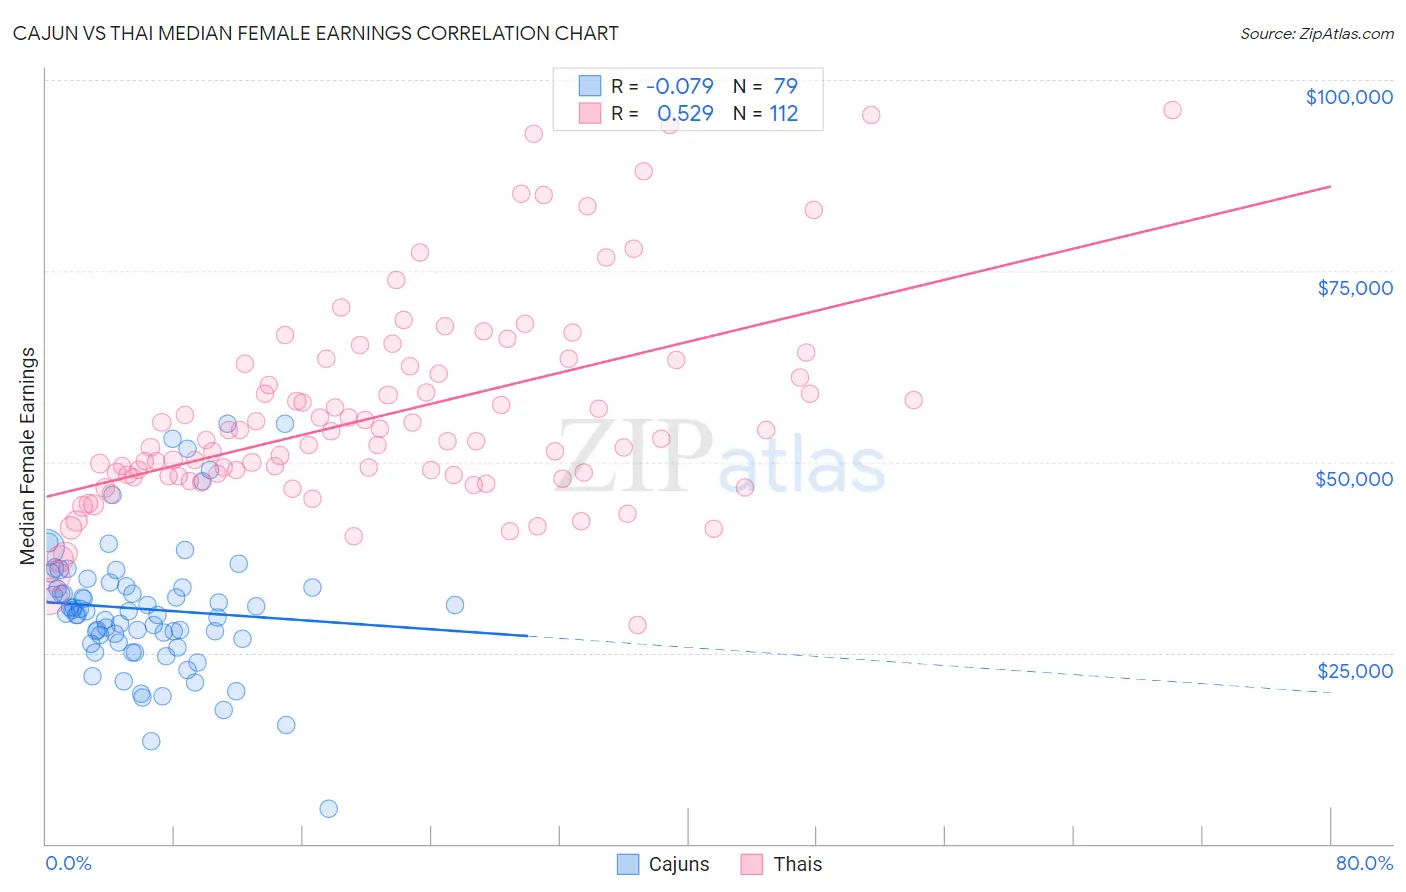
Cajun vs Thai Median Female Earnings Correlation Chart
The statistical analysis conducted on geographies consisting of 149,646,456 people shows a slight negative correlation between the proportion of Cajuns and median female earnings in the United States with a correlation coefficient (R) of -0.079 and weighted average of $34,034. Similarly, the statistical analysis conducted on geographies consisting of 475,636,214 people shows a substantial positive correlation between the proportion of Thais and median female earnings in the United States with a correlation coefficient (R) of 0.529 and weighted average of $47,577, a difference of 39.8%.
Median Female Earnings Correlation Summary
| Measurement | Cajun | Thai |
| Minimum | $4,615 | $28,625 |
| Maximum | $55,000 | $96,063 |
| Range | $50,385 | $67,438 |
| Mean | $30,723 | $56,190 |
| Median | $30,456 | $52,820 |
| Interquartile 25% (IQ1) | $26,402 | $48,126 |
| Interquartile 75% (IQ3) | $33,785 | $62,651 |
| Interquartile Range (IQR) | $7,382 | $14,524 |
| Standard Deviation (Sample) | $8,808 | $13,471 |
| Standard Deviation (Population) | $8,752 | $13,411 |
Similar Demographics by Median Female Earnings
Demographics Similar to Cajuns by Median Female Earnings
In terms of median female earnings, the demographic groups most similar to Cajuns are Kiowa ($34,074, a difference of 0.12%), Dutch West Indian ($34,106, a difference of 0.21%), Immigrants from Central America ($33,953, a difference of 0.24%), Hopi ($33,932, a difference of 0.30%), and Menominee ($33,894, a difference of 0.41%).
| Demographics | Rating | Rank | Median Female Earnings |
| Immigrants | Honduras | 0.0 /100 | #320 | Tragic $34,647 |
| Hispanics or Latinos | 0.0 /100 | #321 | Tragic $34,421 |
| Chickasaw | 0.0 /100 | #322 | Tragic $34,414 |
| Seminole | 0.0 /100 | #323 | Tragic $34,385 |
| Immigrants | Congo | 0.0 /100 | #324 | Tragic $34,317 |
| Dutch West Indians | 0.0 /100 | #325 | Tragic $34,106 |
| Kiowa | 0.0 /100 | #326 | Tragic $34,074 |
| Cajuns | 0.0 /100 | #327 | Tragic $34,034 |
| Immigrants | Central America | 0.0 /100 | #328 | Tragic $33,953 |
| Hopi | 0.0 /100 | #329 | Tragic $33,932 |
| Menominee | 0.0 /100 | #330 | Tragic $33,894 |
| Natives/Alaskans | 0.0 /100 | #331 | Tragic $33,806 |
| Choctaw | 0.0 /100 | #332 | Tragic $33,775 |
| Mexicans | 0.0 /100 | #333 | Tragic $33,664 |
| Spanish American Indians | 0.0 /100 | #334 | Tragic $33,625 |
Demographics Similar to Thais by Median Female Earnings
In terms of median female earnings, the demographic groups most similar to Thais are Immigrants from Ireland ($47,598, a difference of 0.040%), Iranian ($47,421, a difference of 0.33%), Immigrants from Singapore ($47,986, a difference of 0.86%), Immigrants from Iran ($47,154, a difference of 0.90%), and Immigrants from China ($46,972, a difference of 1.3%).
| Demographics | Rating | Rank | Median Female Earnings |
| Immigrants | Hong Kong | 100.0 /100 | #1 | Exceptional $49,818 |
| Filipinos | 100.0 /100 | #2 | Exceptional $49,508 |
| Immigrants | Taiwan | 100.0 /100 | #3 | Exceptional $49,256 |
| Immigrants | India | 100.0 /100 | #4 | Exceptional $48,292 |
| Immigrants | Singapore | 100.0 /100 | #5 | Exceptional $47,986 |
| Immigrants | Ireland | 100.0 /100 | #6 | Exceptional $47,598 |
| Thais | 100.0 /100 | #7 | Exceptional $47,577 |
| Iranians | 100.0 /100 | #8 | Exceptional $47,421 |
| Immigrants | Iran | 100.0 /100 | #9 | Exceptional $47,154 |
| Immigrants | China | 100.0 /100 | #10 | Exceptional $46,972 |
| Okinawans | 100.0 /100 | #11 | Exceptional $46,905 |
| Immigrants | Israel | 100.0 /100 | #12 | Exceptional $46,902 |
| Immigrants | Australia | 100.0 /100 | #13 | Exceptional $46,573 |
| Soviet Union | 100.0 /100 | #14 | Exceptional $46,556 |
| Immigrants | Eastern Asia | 100.0 /100 | #15 | Exceptional $46,502 |