Cajun vs Sri Lankan Median Female Earnings
COMPARE
Cajun
Sri Lankan
Median Female Earnings
Median Female Earnings Comparison
Cajuns
Sri Lankans
$34,034
MEDIAN FEMALE EARNINGS
0.0/ 100
METRIC RATING
327th/ 347
METRIC RANK
$40,496
MEDIAN FEMALE EARNINGS
84.0/ 100
METRIC RATING
142nd/ 347
METRIC RANK
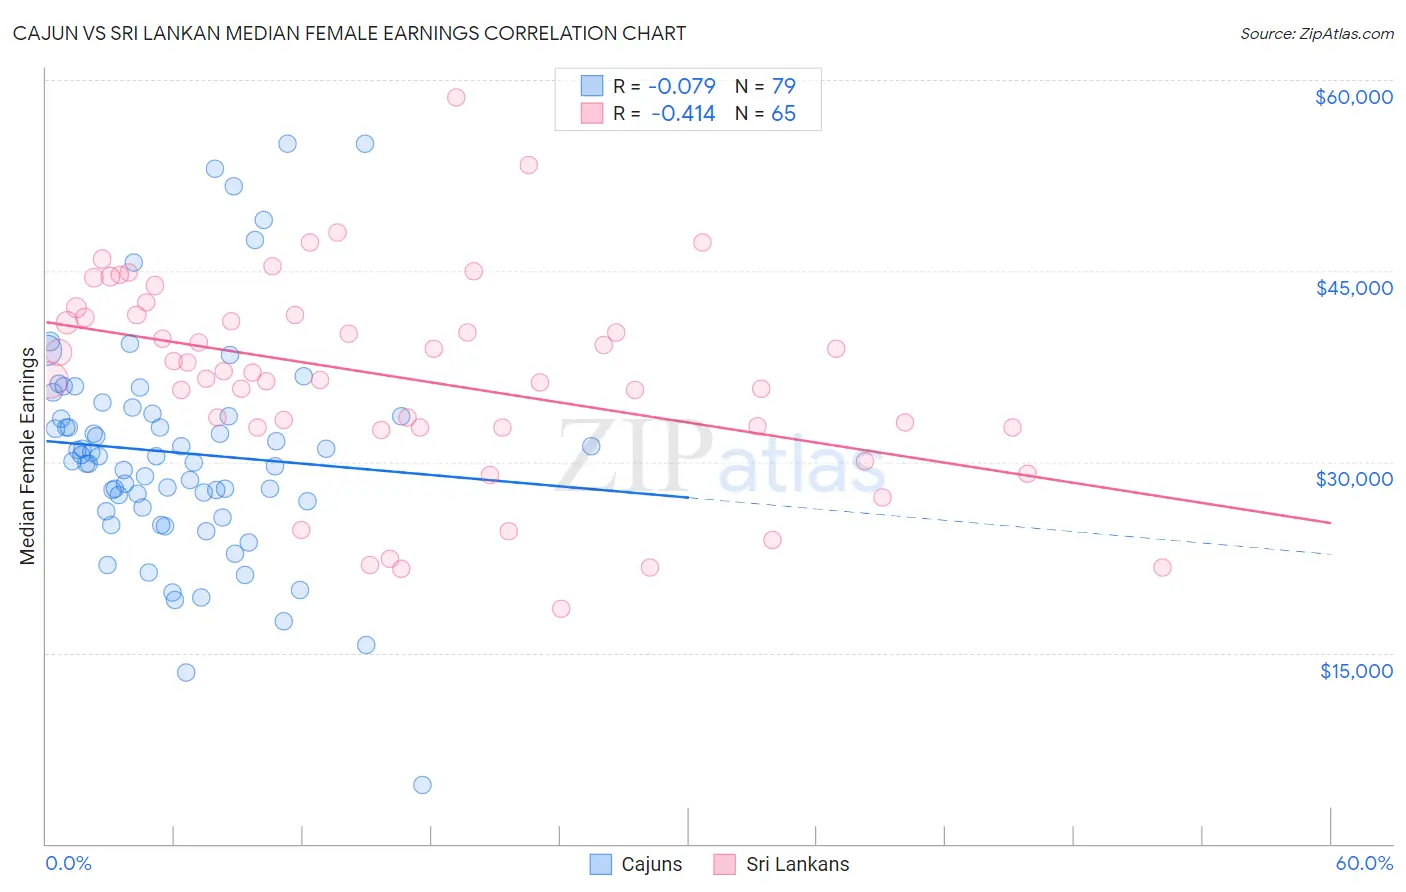
Cajun vs Sri Lankan Median Female Earnings Correlation Chart
The statistical analysis conducted on geographies consisting of 149,646,456 people shows a slight negative correlation between the proportion of Cajuns and median female earnings in the United States with a correlation coefficient (R) of -0.079 and weighted average of $34,034. Similarly, the statistical analysis conducted on geographies consisting of 440,466,993 people shows a moderate negative correlation between the proportion of Sri Lankans and median female earnings in the United States with a correlation coefficient (R) of -0.414 and weighted average of $40,496, a difference of 19.0%.
Median Female Earnings Correlation Summary
| Measurement | Cajun | Sri Lankan |
| Minimum | $4,615 | $18,441 |
| Maximum | $55,000 | $58,654 |
| Range | $50,385 | $40,213 |
| Mean | $30,723 | $36,602 |
| Median | $30,456 | $36,994 |
| Interquartile 25% (IQ1) | $26,402 | $32,729 |
| Interquartile 75% (IQ3) | $33,785 | $41,553 |
| Interquartile Range (IQR) | $7,382 | $8,824 |
| Standard Deviation (Sample) | $8,808 | $8,074 |
| Standard Deviation (Population) | $8,752 | $8,012 |
Similar Demographics by Median Female Earnings
Demographics Similar to Cajuns by Median Female Earnings
In terms of median female earnings, the demographic groups most similar to Cajuns are Kiowa ($34,074, a difference of 0.12%), Dutch West Indian ($34,106, a difference of 0.21%), Immigrants from Central America ($33,953, a difference of 0.24%), Hopi ($33,932, a difference of 0.30%), and Menominee ($33,894, a difference of 0.41%).
| Demographics | Rating | Rank | Median Female Earnings |
| Immigrants | Honduras | 0.0 /100 | #320 | Tragic $34,647 |
| Hispanics or Latinos | 0.0 /100 | #321 | Tragic $34,421 |
| Chickasaw | 0.0 /100 | #322 | Tragic $34,414 |
| Seminole | 0.0 /100 | #323 | Tragic $34,385 |
| Immigrants | Congo | 0.0 /100 | #324 | Tragic $34,317 |
| Dutch West Indians | 0.0 /100 | #325 | Tragic $34,106 |
| Kiowa | 0.0 /100 | #326 | Tragic $34,074 |
| Cajuns | 0.0 /100 | #327 | Tragic $34,034 |
| Immigrants | Central America | 0.0 /100 | #328 | Tragic $33,953 |
| Hopi | 0.0 /100 | #329 | Tragic $33,932 |
| Menominee | 0.0 /100 | #330 | Tragic $33,894 |
| Natives/Alaskans | 0.0 /100 | #331 | Tragic $33,806 |
| Choctaw | 0.0 /100 | #332 | Tragic $33,775 |
| Mexicans | 0.0 /100 | #333 | Tragic $33,664 |
| Spanish American Indians | 0.0 /100 | #334 | Tragic $33,625 |
Demographics Similar to Sri Lankans by Median Female Earnings
In terms of median female earnings, the demographic groups most similar to Sri Lankans are Immigrants from Syria ($40,499, a difference of 0.010%), Northern European ($40,491, a difference of 0.010%), Immigrants from North Macedonia ($40,488, a difference of 0.020%), Brazilian ($40,483, a difference of 0.030%), and Serbian ($40,539, a difference of 0.10%).
| Demographics | Rating | Rank | Median Female Earnings |
| Immigrants | Nepal | 89.0 /100 | #135 | Excellent $40,704 |
| Immigrants | Eastern Africa | 87.7 /100 | #136 | Excellent $40,644 |
| Pakistanis | 86.6 /100 | #137 | Excellent $40,596 |
| Taiwanese | 86.1 /100 | #138 | Excellent $40,576 |
| Immigrants | South Eastern Asia | 85.7 /100 | #139 | Excellent $40,558 |
| Serbians | 85.2 /100 | #140 | Excellent $40,539 |
| Immigrants | Syria | 84.1 /100 | #141 | Excellent $40,499 |
| Sri Lankans | 84.0 /100 | #142 | Excellent $40,496 |
| Northern Europeans | 83.9 /100 | #143 | Excellent $40,491 |
| Immigrants | North Macedonia | 83.8 /100 | #144 | Excellent $40,488 |
| Brazilians | 83.6 /100 | #145 | Excellent $40,483 |
| Ghanaians | 82.1 /100 | #146 | Excellent $40,429 |
| Vietnamese | 80.4 /100 | #147 | Excellent $40,377 |
| Poles | 80.2 /100 | #148 | Excellent $40,371 |
| Immigrants | Cameroon | 79.7 /100 | #149 | Good $40,354 |