Cajun vs Ute Median Female Earnings
COMPARE
Cajun
Ute
Median Female Earnings
Median Female Earnings Comparison
Cajuns
Ute
$34,034
MEDIAN FEMALE EARNINGS
0.0/ 100
METRIC RATING
327th/ 347
METRIC RANK
$34,960
MEDIAN FEMALE EARNINGS
0.0/ 100
METRIC RATING
311th/ 347
METRIC RANK
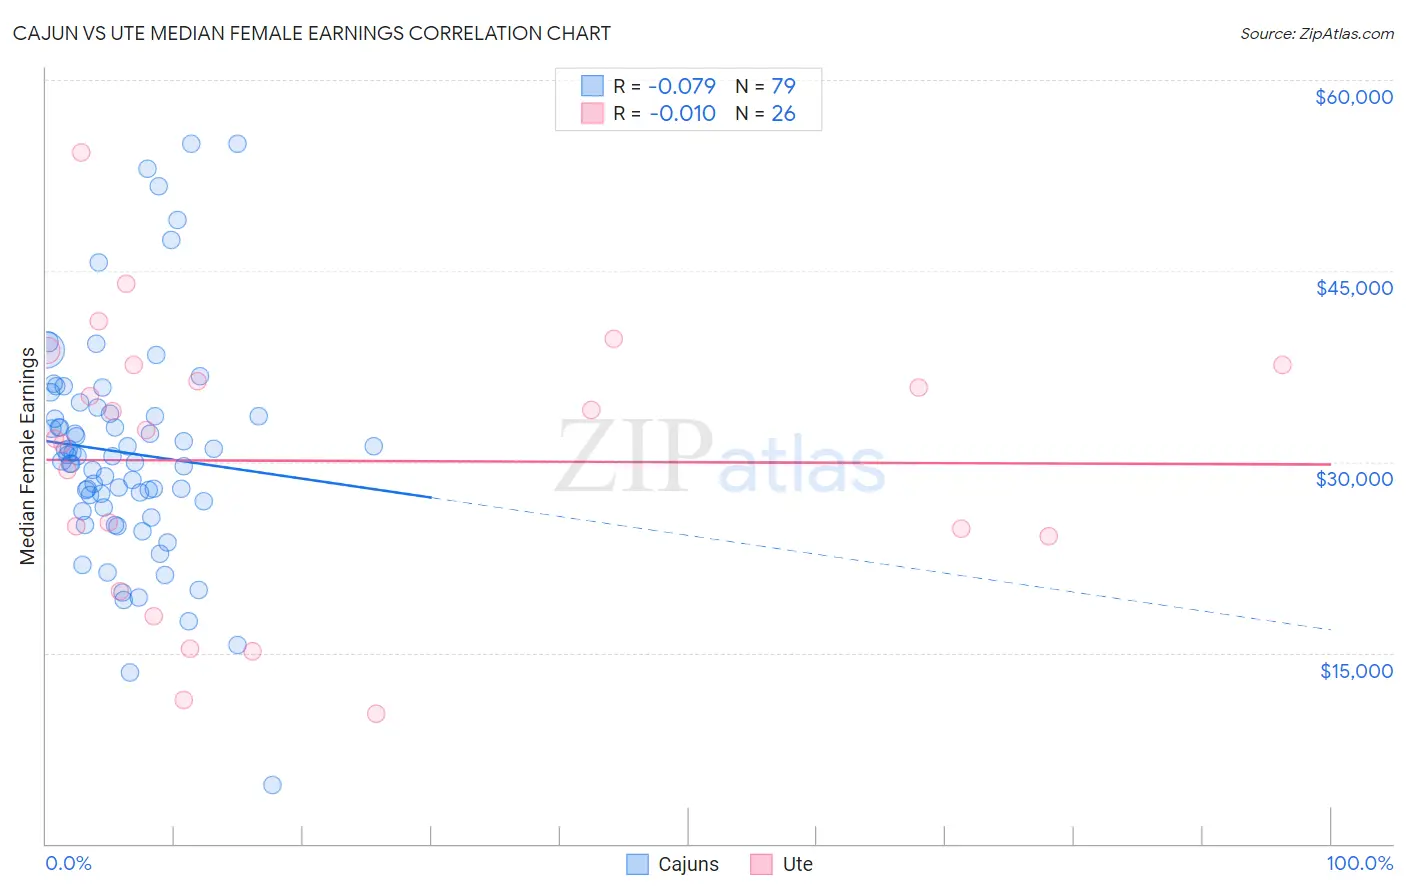
Cajun vs Ute Median Female Earnings Correlation Chart
The statistical analysis conducted on geographies consisting of 149,646,456 people shows a slight negative correlation between the proportion of Cajuns and median female earnings in the United States with a correlation coefficient (R) of -0.079 and weighted average of $34,034. Similarly, the statistical analysis conducted on geographies consisting of 55,659,535 people shows no correlation between the proportion of Ute and median female earnings in the United States with a correlation coefficient (R) of -0.010 and weighted average of $34,960, a difference of 2.7%.
Median Female Earnings Correlation Summary
| Measurement | Cajun | Ute |
| Minimum | $4,615 | $10,250 |
| Maximum | $55,000 | $54,350 |
| Range | $50,385 | $44,100 |
| Mean | $30,723 | $30,088 |
| Median | $30,456 | $32,195 |
| Interquartile 25% (IQ1) | $26,402 | $24,148 |
| Interquartile 75% (IQ3) | $33,785 | $37,604 |
| Interquartile Range (IQR) | $7,382 | $13,456 |
| Standard Deviation (Sample) | $8,808 | $10,734 |
| Standard Deviation (Population) | $8,752 | $10,525 |
Demographics Similar to Cajuns and Ute by Median Female Earnings
In terms of median female earnings, the demographic groups most similar to Cajuns are Kiowa ($34,074, a difference of 0.12%), Dutch West Indian ($34,106, a difference of 0.21%), Immigrants from Central America ($33,953, a difference of 0.24%), Hopi ($33,932, a difference of 0.30%), and Immigrants from Congo ($34,317, a difference of 0.83%). Similarly, the demographic groups most similar to Ute are Yaqui ($34,943, a difference of 0.050%), Cuban ($34,942, a difference of 0.050%), Chippewa ($35,003, a difference of 0.12%), Honduran ($35,013, a difference of 0.15%), and Apache ($34,895, a difference of 0.19%).
| Demographics | Rating | Rank | Median Female Earnings |
| Hondurans | 0.0 /100 | #309 | Tragic $35,013 |
| Chippewa | 0.0 /100 | #310 | Tragic $35,003 |
| Ute | 0.0 /100 | #311 | Tragic $34,960 |
| Yaqui | 0.0 /100 | #312 | Tragic $34,943 |
| Cubans | 0.0 /100 | #313 | Tragic $34,942 |
| Apache | 0.0 /100 | #314 | Tragic $34,895 |
| Pennsylvania Germans | 0.0 /100 | #315 | Tragic $34,802 |
| Cherokee | 0.0 /100 | #316 | Tragic $34,742 |
| Potawatomi | 0.0 /100 | #317 | Tragic $34,739 |
| Immigrants | Yemen | 0.0 /100 | #318 | Tragic $34,693 |
| Shoshone | 0.0 /100 | #319 | Tragic $34,677 |
| Immigrants | Honduras | 0.0 /100 | #320 | Tragic $34,647 |
| Hispanics or Latinos | 0.0 /100 | #321 | Tragic $34,421 |
| Chickasaw | 0.0 /100 | #322 | Tragic $34,414 |
| Seminole | 0.0 /100 | #323 | Tragic $34,385 |
| Immigrants | Congo | 0.0 /100 | #324 | Tragic $34,317 |
| Dutch West Indians | 0.0 /100 | #325 | Tragic $34,106 |
| Kiowa | 0.0 /100 | #326 | Tragic $34,074 |
| Cajuns | 0.0 /100 | #327 | Tragic $34,034 |
| Immigrants | Central America | 0.0 /100 | #328 | Tragic $33,953 |
| Hopi | 0.0 /100 | #329 | Tragic $33,932 |