Cajun vs Immigrants from Somalia Median Female Earnings
COMPARE
Cajun
Immigrants from Somalia
Median Female Earnings
Median Female Earnings Comparison
Cajuns
Immigrants from Somalia
$34,034
MEDIAN FEMALE EARNINGS
0.0/ 100
METRIC RATING
327th/ 347
METRIC RANK
$37,914
MEDIAN FEMALE EARNINGS
2.4/ 100
METRIC RATING
247th/ 347
METRIC RANK
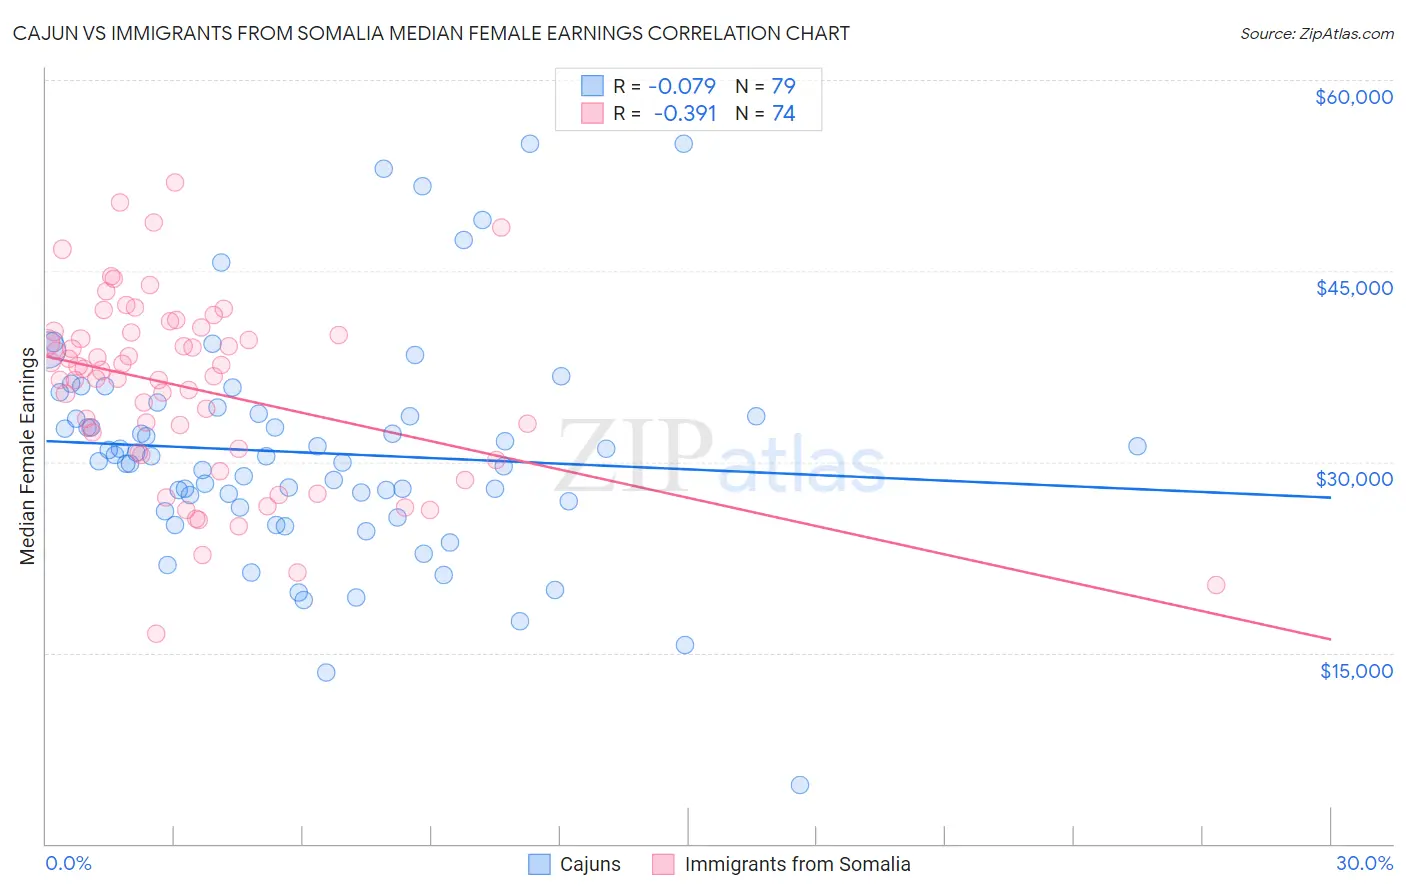
Cajun vs Immigrants from Somalia Median Female Earnings Correlation Chart
The statistical analysis conducted on geographies consisting of 149,646,456 people shows a slight negative correlation between the proportion of Cajuns and median female earnings in the United States with a correlation coefficient (R) of -0.079 and weighted average of $34,034. Similarly, the statistical analysis conducted on geographies consisting of 92,105,737 people shows a mild negative correlation between the proportion of Immigrants from Somalia and median female earnings in the United States with a correlation coefficient (R) of -0.391 and weighted average of $37,914, a difference of 11.4%.
Median Female Earnings Correlation Summary
| Measurement | Cajun | Immigrants from Somalia |
| Minimum | $4,615 | $16,542 |
| Maximum | $55,000 | $51,945 |
| Range | $50,385 | $35,403 |
| Mean | $30,723 | $35,740 |
| Median | $30,456 | $36,925 |
| Interquartile 25% (IQ1) | $26,402 | $30,785 |
| Interquartile 75% (IQ3) | $33,785 | $40,139 |
| Interquartile Range (IQR) | $7,382 | $9,354 |
| Standard Deviation (Sample) | $8,808 | $7,218 |
| Standard Deviation (Population) | $8,752 | $7,169 |
Similar Demographics by Median Female Earnings
Demographics Similar to Cajuns by Median Female Earnings
In terms of median female earnings, the demographic groups most similar to Cajuns are Kiowa ($34,074, a difference of 0.12%), Dutch West Indian ($34,106, a difference of 0.21%), Immigrants from Central America ($33,953, a difference of 0.24%), Hopi ($33,932, a difference of 0.30%), and Menominee ($33,894, a difference of 0.41%).
| Demographics | Rating | Rank | Median Female Earnings |
| Immigrants | Honduras | 0.0 /100 | #320 | Tragic $34,647 |
| Hispanics or Latinos | 0.0 /100 | #321 | Tragic $34,421 |
| Chickasaw | 0.0 /100 | #322 | Tragic $34,414 |
| Seminole | 0.0 /100 | #323 | Tragic $34,385 |
| Immigrants | Congo | 0.0 /100 | #324 | Tragic $34,317 |
| Dutch West Indians | 0.0 /100 | #325 | Tragic $34,106 |
| Kiowa | 0.0 /100 | #326 | Tragic $34,074 |
| Cajuns | 0.0 /100 | #327 | Tragic $34,034 |
| Immigrants | Central America | 0.0 /100 | #328 | Tragic $33,953 |
| Hopi | 0.0 /100 | #329 | Tragic $33,932 |
| Menominee | 0.0 /100 | #330 | Tragic $33,894 |
| Natives/Alaskans | 0.0 /100 | #331 | Tragic $33,806 |
| Choctaw | 0.0 /100 | #332 | Tragic $33,775 |
| Mexicans | 0.0 /100 | #333 | Tragic $33,664 |
| Spanish American Indians | 0.0 /100 | #334 | Tragic $33,625 |
Demographics Similar to Immigrants from Somalia by Median Female Earnings
In terms of median female earnings, the demographic groups most similar to Immigrants from Somalia are Alaskan Athabascan ($37,905, a difference of 0.020%), Swiss ($37,904, a difference of 0.030%), Delaware ($37,964, a difference of 0.13%), Immigrants from Iraq ($37,864, a difference of 0.13%), and Immigrants from Middle Africa ($37,965, a difference of 0.14%).
| Demographics | Rating | Rank | Median Female Earnings |
| Finns | 4.0 /100 | #240 | Tragic $38,173 |
| Spanish | 3.5 /100 | #241 | Tragic $38,098 |
| Immigrants | Burma/Myanmar | 3.0 /100 | #242 | Tragic $38,028 |
| Germans | 2.8 /100 | #243 | Tragic $37,986 |
| Immigrants | Liberia | 2.7 /100 | #244 | Tragic $37,970 |
| Immigrants | Middle Africa | 2.7 /100 | #245 | Tragic $37,965 |
| Delaware | 2.6 /100 | #246 | Tragic $37,964 |
| Immigrants | Somalia | 2.4 /100 | #247 | Tragic $37,914 |
| Alaskan Athabascans | 2.3 /100 | #248 | Tragic $37,905 |
| Swiss | 2.3 /100 | #249 | Tragic $37,904 |
| Immigrants | Iraq | 2.2 /100 | #250 | Tragic $37,864 |
| Welsh | 2.1 /100 | #251 | Tragic $37,856 |
| Immigrants | Dominica | 2.0 /100 | #252 | Tragic $37,825 |
| Danes | 1.6 /100 | #253 | Tragic $37,730 |
| Whites/Caucasians | 1.1 /100 | #254 | Tragic $37,531 |