Ottawa vs Salvadoran Median Female Earnings
COMPARE
Ottawa
Salvadoran
Median Female Earnings
Median Female Earnings Comparison
Ottawa
Salvadorans
$33,378
MEDIAN FEMALE EARNINGS
0.0/ 100
METRIC RATING
336th/ 347
METRIC RANK
$37,083
MEDIAN FEMALE EARNINGS
0.4/ 100
METRIC RATING
264th/ 347
METRIC RANK
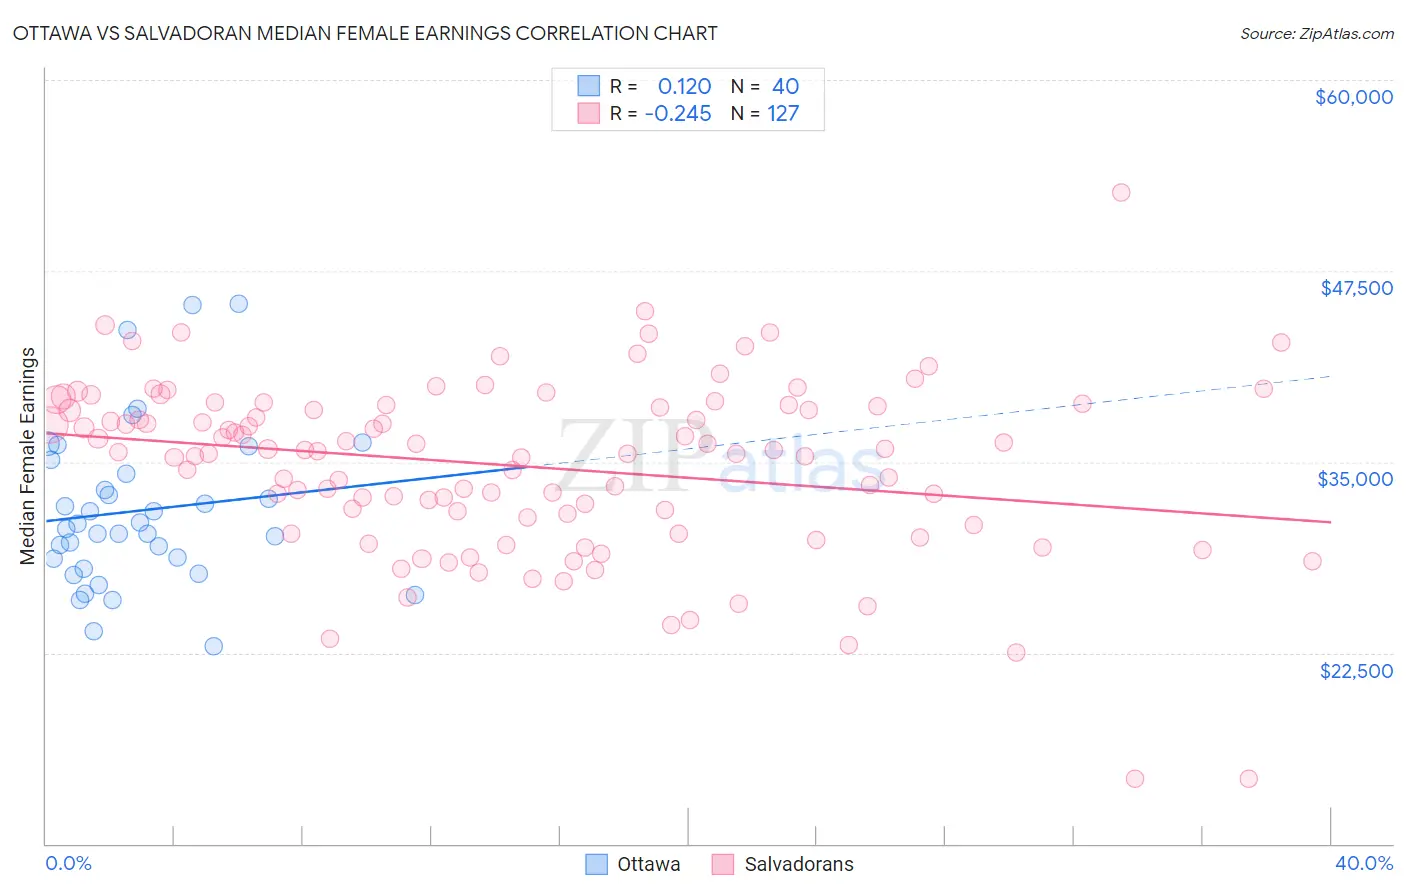
Ottawa vs Salvadoran Median Female Earnings Correlation Chart
The statistical analysis conducted on geographies consisting of 49,946,188 people shows a poor positive correlation between the proportion of Ottawa and median female earnings in the United States with a correlation coefficient (R) of 0.120 and weighted average of $33,378. Similarly, the statistical analysis conducted on geographies consisting of 398,898,517 people shows a weak negative correlation between the proportion of Salvadorans and median female earnings in the United States with a correlation coefficient (R) of -0.245 and weighted average of $37,083, a difference of 11.1%.
Median Female Earnings Correlation Summary
| Measurement | Ottawa | Salvadoran |
| Minimum | $22,891 | $14,245 |
| Maximum | $45,375 | $52,604 |
| Range | $22,484 | $38,359 |
| Mean | $31,817 | $34,711 |
| Median | $30,771 | $35,673 |
| Interquartile 25% (IQ1) | $28,352 | $31,372 |
| Interquartile 75% (IQ3) | $34,654 | $38,695 |
| Interquartile Range (IQR) | $6,302 | $7,323 |
| Standard Deviation (Sample) | $5,248 | $5,811 |
| Standard Deviation (Population) | $5,182 | $5,788 |
Similar Demographics by Median Female Earnings
Demographics Similar to Ottawa by Median Female Earnings
In terms of median female earnings, the demographic groups most similar to Ottawa are Yakama ($33,354, a difference of 0.070%), Creek ($33,437, a difference of 0.18%), Immigrants from Cuba ($33,291, a difference of 0.26%), Immigrants from Mexico ($33,236, a difference of 0.43%), and Tohono O'odham ($33,205, a difference of 0.52%).
| Demographics | Rating | Rank | Median Female Earnings |
| Hopi | 0.0 /100 | #329 | Tragic $33,932 |
| Menominee | 0.0 /100 | #330 | Tragic $33,894 |
| Natives/Alaskans | 0.0 /100 | #331 | Tragic $33,806 |
| Choctaw | 0.0 /100 | #332 | Tragic $33,775 |
| Mexicans | 0.0 /100 | #333 | Tragic $33,664 |
| Spanish American Indians | 0.0 /100 | #334 | Tragic $33,625 |
| Creek | 0.0 /100 | #335 | Tragic $33,437 |
| Ottawa | 0.0 /100 | #336 | Tragic $33,378 |
| Yakama | 0.0 /100 | #337 | Tragic $33,354 |
| Immigrants | Cuba | 0.0 /100 | #338 | Tragic $33,291 |
| Immigrants | Mexico | 0.0 /100 | #339 | Tragic $33,236 |
| Tohono O'odham | 0.0 /100 | #340 | Tragic $33,205 |
| Navajo | 0.0 /100 | #341 | Tragic $33,046 |
| Yup'ik | 0.0 /100 | #342 | Tragic $32,730 |
| Pueblo | 0.0 /100 | #343 | Tragic $32,564 |
Demographics Similar to Salvadorans by Median Female Earnings
In terms of median female earnings, the demographic groups most similar to Salvadorans are German Russian ($37,105, a difference of 0.060%), Immigrants from Belize ($37,056, a difference of 0.070%), Dominican ($37,046, a difference of 0.10%), Nonimmigrants ($37,024, a difference of 0.16%), and Cree ($37,018, a difference of 0.18%).
| Demographics | Rating | Rank | Median Female Earnings |
| Hawaiians | 1.0 /100 | #257 | Tragic $37,497 |
| Belizeans | 0.9 /100 | #258 | Tragic $37,429 |
| Scotch-Irish | 0.8 /100 | #259 | Tragic $37,383 |
| Dutch | 0.7 /100 | #260 | Tragic $37,339 |
| Malaysians | 0.7 /100 | #261 | Tragic $37,298 |
| Venezuelans | 0.7 /100 | #262 | Tragic $37,282 |
| German Russians | 0.5 /100 | #263 | Tragic $37,105 |
| Salvadorans | 0.4 /100 | #264 | Tragic $37,083 |
| Immigrants | Belize | 0.4 /100 | #265 | Tragic $37,056 |
| Dominicans | 0.4 /100 | #266 | Tragic $37,046 |
| Immigrants | Nonimmigrants | 0.4 /100 | #267 | Tragic $37,024 |
| Cree | 0.4 /100 | #268 | Tragic $37,018 |
| Immigrants | Venezuela | 0.4 /100 | #269 | Tragic $37,003 |
| French American Indians | 0.3 /100 | #270 | Tragic $36,920 |
| Nicaraguans | 0.3 /100 | #271 | Tragic $36,904 |