Alaska Native vs Salvadoran Median Female Earnings
COMPARE
Alaska Native
Salvadoran
Median Female Earnings
Median Female Earnings Comparison
Alaska Natives
Salvadorans
$38,202
MEDIAN FEMALE EARNINGS
4.3/ 100
METRIC RATING
238th/ 347
METRIC RANK
$37,083
MEDIAN FEMALE EARNINGS
0.4/ 100
METRIC RATING
264th/ 347
METRIC RANK
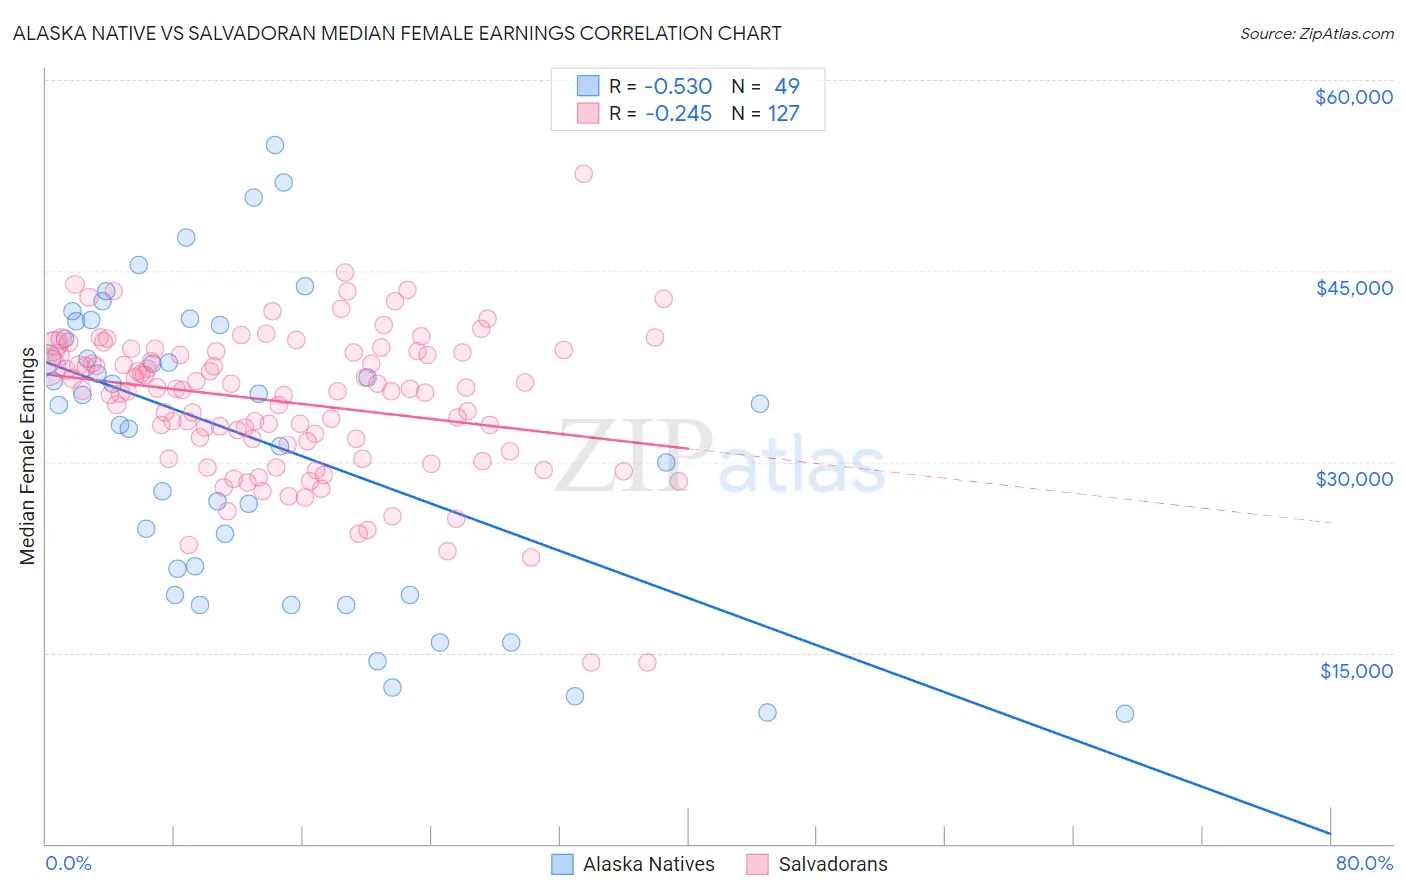
Alaska Native vs Salvadoran Median Female Earnings Correlation Chart
The statistical analysis conducted on geographies consisting of 76,744,414 people shows a substantial negative correlation between the proportion of Alaska Natives and median female earnings in the United States with a correlation coefficient (R) of -0.530 and weighted average of $38,202. Similarly, the statistical analysis conducted on geographies consisting of 398,898,517 people shows a weak negative correlation between the proportion of Salvadorans and median female earnings in the United States with a correlation coefficient (R) of -0.245 and weighted average of $37,083, a difference of 3.0%.
Median Female Earnings Correlation Summary
| Measurement | Alaska Native | Salvadoran |
| Minimum | $10,250 | $14,245 |
| Maximum | $54,922 | $52,604 |
| Range | $44,672 | $38,359 |
| Mean | $31,635 | $34,711 |
| Median | $34,583 | $35,673 |
| Interquartile 25% (IQ1) | $20,573 | $31,372 |
| Interquartile 75% (IQ3) | $40,922 | $38,695 |
| Interquartile Range (IQR) | $20,349 | $7,323 |
| Standard Deviation (Sample) | $11,761 | $5,811 |
| Standard Deviation (Population) | $11,640 | $5,788 |
Similar Demographics by Median Female Earnings
Demographics Similar to Alaska Natives by Median Female Earnings
In terms of median female earnings, the demographic groups most similar to Alaska Natives are Immigrants from Cabo Verde ($38,208, a difference of 0.020%), English ($38,196, a difference of 0.020%), Liberian ($38,215, a difference of 0.030%), Sudanese ($38,215, a difference of 0.040%), and Finnish ($38,173, a difference of 0.080%).
| Demographics | Rating | Rank | Median Female Earnings |
| Somalis | 5.5 /100 | #231 | Tragic $38,333 |
| Scandinavians | 5.2 /100 | #232 | Tragic $38,306 |
| Tongans | 5.1 /100 | #233 | Tragic $38,288 |
| Celtics | 5.0 /100 | #234 | Tragic $38,283 |
| Sudanese | 4.4 /100 | #235 | Tragic $38,215 |
| Liberians | 4.4 /100 | #236 | Tragic $38,215 |
| Immigrants | Cabo Verde | 4.3 /100 | #237 | Tragic $38,208 |
| Alaska Natives | 4.3 /100 | #238 | Tragic $38,202 |
| English | 4.2 /100 | #239 | Tragic $38,196 |
| Finns | 4.0 /100 | #240 | Tragic $38,173 |
| Spanish | 3.5 /100 | #241 | Tragic $38,098 |
| Immigrants | Burma/Myanmar | 3.0 /100 | #242 | Tragic $38,028 |
| Germans | 2.8 /100 | #243 | Tragic $37,986 |
| Immigrants | Liberia | 2.7 /100 | #244 | Tragic $37,970 |
| Immigrants | Middle Africa | 2.7 /100 | #245 | Tragic $37,965 |
Demographics Similar to Salvadorans by Median Female Earnings
In terms of median female earnings, the demographic groups most similar to Salvadorans are German Russian ($37,105, a difference of 0.060%), Immigrants from Belize ($37,056, a difference of 0.070%), Dominican ($37,046, a difference of 0.10%), Nonimmigrants ($37,024, a difference of 0.16%), and Cree ($37,018, a difference of 0.18%).
| Demographics | Rating | Rank | Median Female Earnings |
| Hawaiians | 1.0 /100 | #257 | Tragic $37,497 |
| Belizeans | 0.9 /100 | #258 | Tragic $37,429 |
| Scotch-Irish | 0.8 /100 | #259 | Tragic $37,383 |
| Dutch | 0.7 /100 | #260 | Tragic $37,339 |
| Malaysians | 0.7 /100 | #261 | Tragic $37,298 |
| Venezuelans | 0.7 /100 | #262 | Tragic $37,282 |
| German Russians | 0.5 /100 | #263 | Tragic $37,105 |
| Salvadorans | 0.4 /100 | #264 | Tragic $37,083 |
| Immigrants | Belize | 0.4 /100 | #265 | Tragic $37,056 |
| Dominicans | 0.4 /100 | #266 | Tragic $37,046 |
| Immigrants | Nonimmigrants | 0.4 /100 | #267 | Tragic $37,024 |
| Cree | 0.4 /100 | #268 | Tragic $37,018 |
| Immigrants | Venezuela | 0.4 /100 | #269 | Tragic $37,003 |
| French American Indians | 0.3 /100 | #270 | Tragic $36,920 |
| Nicaraguans | 0.3 /100 | #271 | Tragic $36,904 |