Cajun vs Maltese Median Female Earnings
COMPARE
Cajun
Maltese
Median Female Earnings
Median Female Earnings Comparison
Cajuns
Maltese
$34,034
MEDIAN FEMALE EARNINGS
0.0/ 100
METRIC RATING
327th/ 347
METRIC RANK
$43,357
MEDIAN FEMALE EARNINGS
100.0/ 100
METRIC RATING
51st/ 347
METRIC RANK
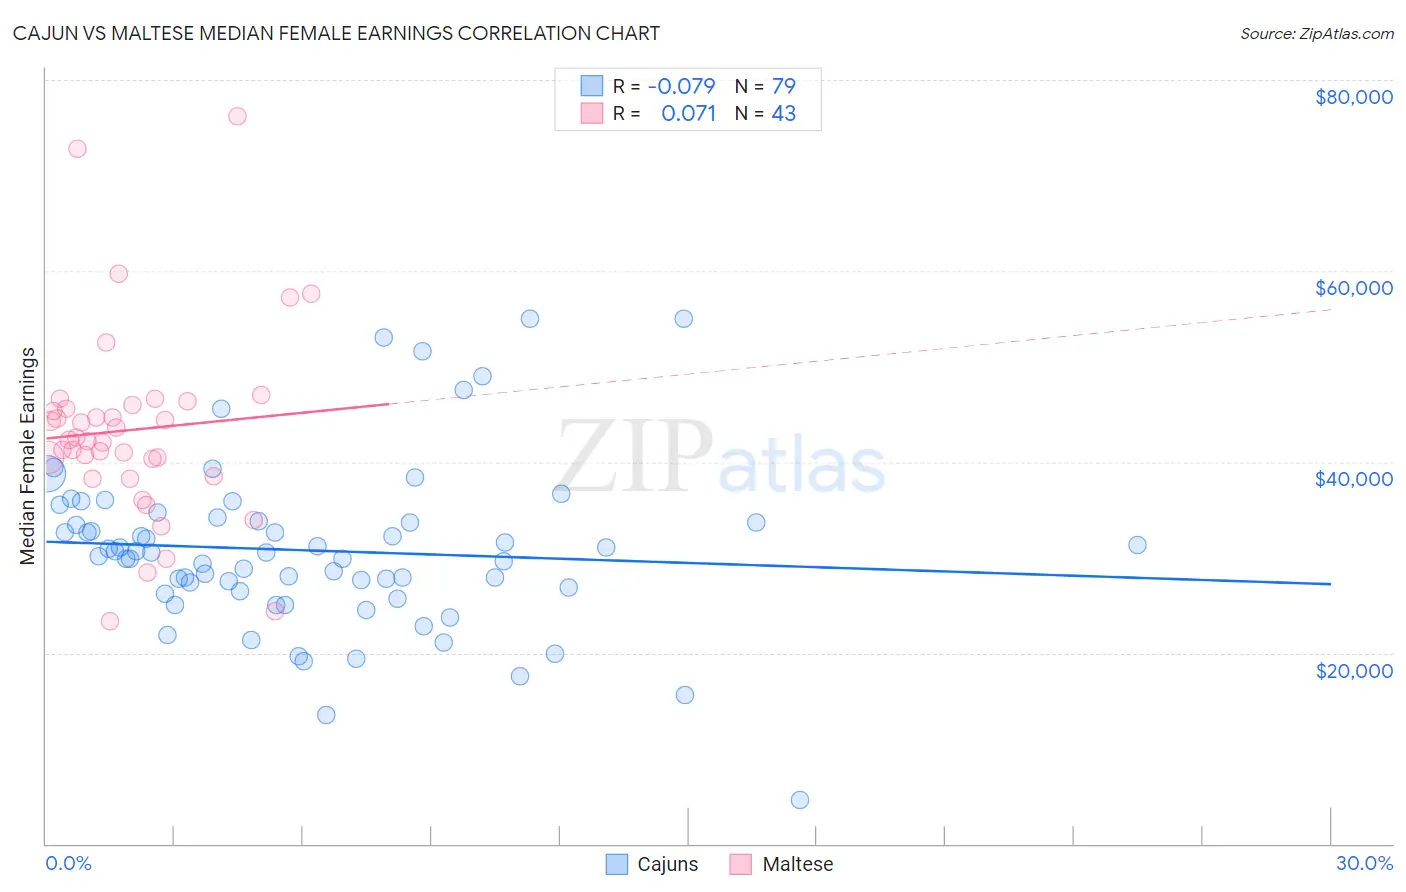
Cajun vs Maltese Median Female Earnings Correlation Chart
The statistical analysis conducted on geographies consisting of 149,646,456 people shows a slight negative correlation between the proportion of Cajuns and median female earnings in the United States with a correlation coefficient (R) of -0.079 and weighted average of $34,034. Similarly, the statistical analysis conducted on geographies consisting of 126,447,525 people shows a slight positive correlation between the proportion of Maltese and median female earnings in the United States with a correlation coefficient (R) of 0.071 and weighted average of $43,357, a difference of 27.4%.
Median Female Earnings Correlation Summary
| Measurement | Cajun | Maltese |
| Minimum | $4,615 | $23,250 |
| Maximum | $55,000 | $76,250 |
| Range | $50,385 | $53,000 |
| Mean | $30,723 | $43,370 |
| Median | $30,456 | $42,338 |
| Interquartile 25% (IQ1) | $26,402 | $38,447 |
| Interquartile 75% (IQ3) | $33,785 | $45,921 |
| Interquartile Range (IQR) | $7,382 | $7,474 |
| Standard Deviation (Sample) | $8,808 | $10,204 |
| Standard Deviation (Population) | $8,752 | $10,085 |
Similar Demographics by Median Female Earnings
Demographics Similar to Cajuns by Median Female Earnings
In terms of median female earnings, the demographic groups most similar to Cajuns are Kiowa ($34,074, a difference of 0.12%), Dutch West Indian ($34,106, a difference of 0.21%), Immigrants from Central America ($33,953, a difference of 0.24%), Hopi ($33,932, a difference of 0.30%), and Menominee ($33,894, a difference of 0.41%).
| Demographics | Rating | Rank | Median Female Earnings |
| Immigrants | Honduras | 0.0 /100 | #320 | Tragic $34,647 |
| Hispanics or Latinos | 0.0 /100 | #321 | Tragic $34,421 |
| Chickasaw | 0.0 /100 | #322 | Tragic $34,414 |
| Seminole | 0.0 /100 | #323 | Tragic $34,385 |
| Immigrants | Congo | 0.0 /100 | #324 | Tragic $34,317 |
| Dutch West Indians | 0.0 /100 | #325 | Tragic $34,106 |
| Kiowa | 0.0 /100 | #326 | Tragic $34,074 |
| Cajuns | 0.0 /100 | #327 | Tragic $34,034 |
| Immigrants | Central America | 0.0 /100 | #328 | Tragic $33,953 |
| Hopi | 0.0 /100 | #329 | Tragic $33,932 |
| Menominee | 0.0 /100 | #330 | Tragic $33,894 |
| Natives/Alaskans | 0.0 /100 | #331 | Tragic $33,806 |
| Choctaw | 0.0 /100 | #332 | Tragic $33,775 |
| Mexicans | 0.0 /100 | #333 | Tragic $33,664 |
| Spanish American Indians | 0.0 /100 | #334 | Tragic $33,625 |
Demographics Similar to Maltese by Median Female Earnings
In terms of median female earnings, the demographic groups most similar to Maltese are Immigrants from Uzbekistan ($43,363, a difference of 0.010%), Immigrants from Serbia ($43,385, a difference of 0.060%), Immigrants from Lithuania ($43,317, a difference of 0.090%), Immigrants from Eastern Europe ($43,309, a difference of 0.11%), and Australian ($43,308, a difference of 0.11%).
| Demographics | Rating | Rank | Median Female Earnings |
| Immigrants | Czechoslovakia | 100.0 /100 | #44 | Exceptional $43,571 |
| Immigrants | Europe | 100.0 /100 | #45 | Exceptional $43,523 |
| Immigrants | Bolivia | 100.0 /100 | #46 | Exceptional $43,467 |
| Bolivians | 100.0 /100 | #47 | Exceptional $43,445 |
| Immigrants | Indonesia | 100.0 /100 | #48 | Exceptional $43,412 |
| Immigrants | Serbia | 100.0 /100 | #49 | Exceptional $43,385 |
| Immigrants | Uzbekistan | 100.0 /100 | #50 | Exceptional $43,363 |
| Maltese | 100.0 /100 | #51 | Exceptional $43,357 |
| Immigrants | Lithuania | 99.9 /100 | #52 | Exceptional $43,317 |
| Immigrants | Eastern Europe | 99.9 /100 | #53 | Exceptional $43,309 |
| Australians | 99.9 /100 | #54 | Exceptional $43,308 |
| Egyptians | 99.9 /100 | #55 | Exceptional $43,305 |
| Immigrants | Croatia | 99.9 /100 | #56 | Exceptional $43,258 |
| Ethiopians | 99.9 /100 | #57 | Exceptional $43,243 |
| Paraguayans | 99.9 /100 | #58 | Exceptional $43,173 |