Immigrants from Somalia vs Salvadoran Median Female Earnings
COMPARE
Immigrants from Somalia
Salvadoran
Median Female Earnings
Median Female Earnings Comparison
Immigrants from Somalia
Salvadorans
$37,914
MEDIAN FEMALE EARNINGS
2.4/ 100
METRIC RATING
247th/ 347
METRIC RANK
$37,083
MEDIAN FEMALE EARNINGS
0.4/ 100
METRIC RATING
264th/ 347
METRIC RANK
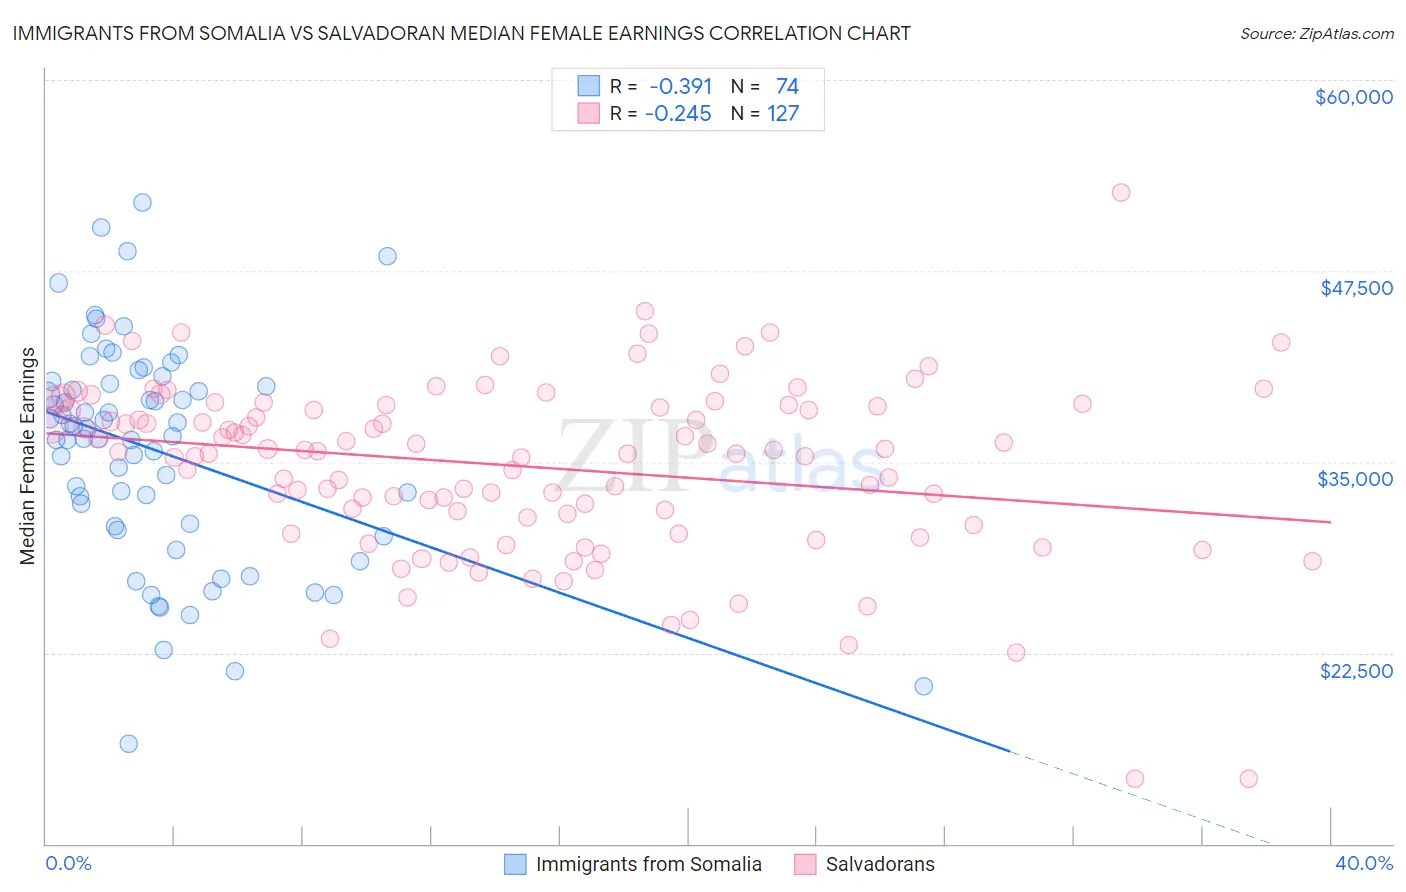
Immigrants from Somalia vs Salvadoran Median Female Earnings Correlation Chart
The statistical analysis conducted on geographies consisting of 92,105,737 people shows a mild negative correlation between the proportion of Immigrants from Somalia and median female earnings in the United States with a correlation coefficient (R) of -0.391 and weighted average of $37,914. Similarly, the statistical analysis conducted on geographies consisting of 398,898,517 people shows a weak negative correlation between the proportion of Salvadorans and median female earnings in the United States with a correlation coefficient (R) of -0.245 and weighted average of $37,083, a difference of 2.2%.
Median Female Earnings Correlation Summary
| Measurement | Immigrants from Somalia | Salvadoran |
| Minimum | $16,542 | $14,245 |
| Maximum | $51,945 | $52,604 |
| Range | $35,403 | $38,359 |
| Mean | $35,740 | $34,711 |
| Median | $36,925 | $35,673 |
| Interquartile 25% (IQ1) | $30,785 | $31,372 |
| Interquartile 75% (IQ3) | $40,139 | $38,695 |
| Interquartile Range (IQR) | $9,354 | $7,323 |
| Standard Deviation (Sample) | $7,218 | $5,811 |
| Standard Deviation (Population) | $7,169 | $5,788 |
Demographics Similar to Immigrants from Somalia and Salvadorans by Median Female Earnings
In terms of median female earnings, the demographic groups most similar to Immigrants from Somalia are Alaskan Athabascan ($37,905, a difference of 0.020%), Swiss ($37,904, a difference of 0.030%), Delaware ($37,964, a difference of 0.13%), Immigrants from Iraq ($37,864, a difference of 0.13%), and Immigrants from Middle Africa ($37,965, a difference of 0.14%). Similarly, the demographic groups most similar to Salvadorans are German Russian ($37,105, a difference of 0.060%), Immigrants from Belize ($37,056, a difference of 0.070%), Venezuelan ($37,282, a difference of 0.54%), Malaysian ($37,298, a difference of 0.58%), and Dutch ($37,339, a difference of 0.69%).
| Demographics | Rating | Rank | Median Female Earnings |
| Immigrants | Middle Africa | 2.7 /100 | #245 | Tragic $37,965 |
| Delaware | 2.6 /100 | #246 | Tragic $37,964 |
| Immigrants | Somalia | 2.4 /100 | #247 | Tragic $37,914 |
| Alaskan Athabascans | 2.3 /100 | #248 | Tragic $37,905 |
| Swiss | 2.3 /100 | #249 | Tragic $37,904 |
| Immigrants | Iraq | 2.2 /100 | #250 | Tragic $37,864 |
| Welsh | 2.1 /100 | #251 | Tragic $37,856 |
| Immigrants | Dominica | 2.0 /100 | #252 | Tragic $37,825 |
| Danes | 1.6 /100 | #253 | Tragic $37,730 |
| Whites/Caucasians | 1.1 /100 | #254 | Tragic $37,531 |
| Colville | 1.1 /100 | #255 | Tragic $37,514 |
| Samoans | 1.0 /100 | #256 | Tragic $37,498 |
| Hawaiians | 1.0 /100 | #257 | Tragic $37,497 |
| Belizeans | 0.9 /100 | #258 | Tragic $37,429 |
| Scotch-Irish | 0.8 /100 | #259 | Tragic $37,383 |
| Dutch | 0.7 /100 | #260 | Tragic $37,339 |
| Malaysians | 0.7 /100 | #261 | Tragic $37,298 |
| Venezuelans | 0.7 /100 | #262 | Tragic $37,282 |
| German Russians | 0.5 /100 | #263 | Tragic $37,105 |
| Salvadorans | 0.4 /100 | #264 | Tragic $37,083 |
| Immigrants | Belize | 0.4 /100 | #265 | Tragic $37,056 |