Immigrants from Nigeria vs Maltese Median Female Earnings
COMPARE
Immigrants from Nigeria
Maltese
Median Female Earnings
Median Female Earnings Comparison
Immigrants from Nigeria
Maltese
$39,294
MEDIAN FEMALE EARNINGS
30.2/ 100
METRIC RATING
193rd/ 347
METRIC RANK
$43,357
MEDIAN FEMALE EARNINGS
100.0/ 100
METRIC RATING
51st/ 347
METRIC RANK
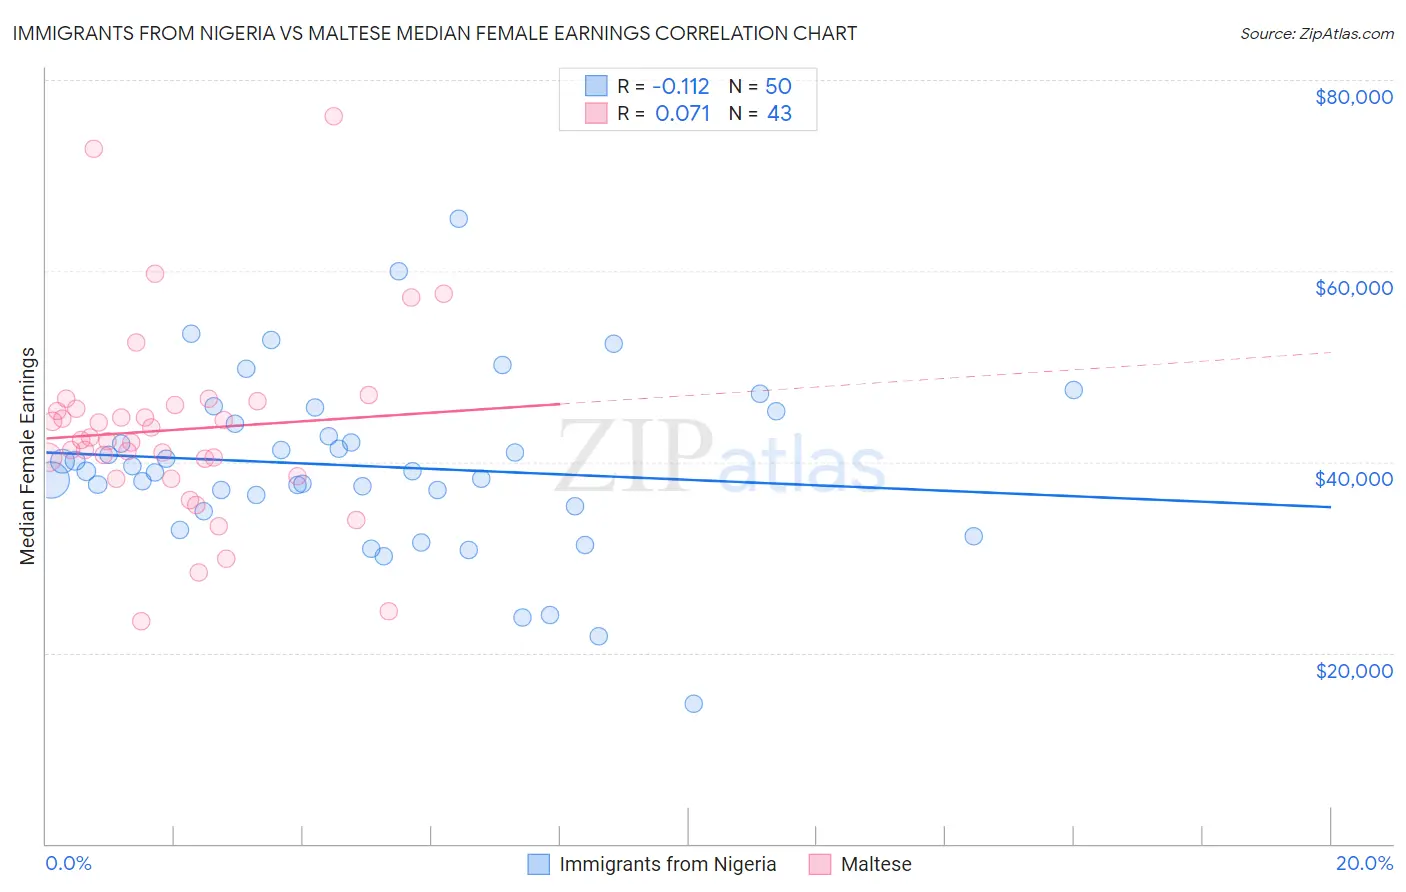
Immigrants from Nigeria vs Maltese Median Female Earnings Correlation Chart
The statistical analysis conducted on geographies consisting of 283,458,757 people shows a poor negative correlation between the proportion of Immigrants from Nigeria and median female earnings in the United States with a correlation coefficient (R) of -0.112 and weighted average of $39,294. Similarly, the statistical analysis conducted on geographies consisting of 126,447,525 people shows a slight positive correlation between the proportion of Maltese and median female earnings in the United States with a correlation coefficient (R) of 0.071 and weighted average of $43,357, a difference of 10.3%.
Median Female Earnings Correlation Summary
| Measurement | Immigrants from Nigeria | Maltese |
| Minimum | $14,696 | $23,250 |
| Maximum | $65,528 | $76,250 |
| Range | $50,832 | $53,000 |
| Mean | $39,545 | $43,370 |
| Median | $39,021 | $42,338 |
| Interquartile 25% (IQ1) | $35,340 | $38,447 |
| Interquartile 75% (IQ3) | $44,001 | $45,921 |
| Interquartile Range (IQR) | $8,661 | $7,474 |
| Standard Deviation (Sample) | $9,154 | $10,204 |
| Standard Deviation (Population) | $9,062 | $10,085 |
Similar Demographics by Median Female Earnings
Demographics Similar to Immigrants from Nigeria by Median Female Earnings
In terms of median female earnings, the demographic groups most similar to Immigrants from Nigeria are Irish ($39,291, a difference of 0.010%), Immigrants ($39,328, a difference of 0.090%), Immigrants from Western Africa ($39,351, a difference of 0.14%), Uruguayan ($39,228, a difference of 0.17%), and Puget Sound Salish ($39,376, a difference of 0.21%).
| Demographics | Rating | Rank | Median Female Earnings |
| Colombians | 36.9 /100 | #186 | Fair $39,439 |
| Swedes | 36.0 /100 | #187 | Fair $39,421 |
| Bermudans | 35.9 /100 | #188 | Fair $39,418 |
| Senegalese | 34.2 /100 | #189 | Fair $39,384 |
| Puget Sound Salish | 33.9 /100 | #190 | Fair $39,376 |
| Immigrants | Western Africa | 32.7 /100 | #191 | Fair $39,351 |
| Immigrants | Immigrants | 31.7 /100 | #192 | Fair $39,328 |
| Immigrants | Nigeria | 30.2 /100 | #193 | Fair $39,294 |
| Irish | 30.0 /100 | #194 | Fair $39,291 |
| Uruguayans | 27.3 /100 | #195 | Fair $39,228 |
| Immigrants | Costa Rica | 25.6 /100 | #196 | Fair $39,186 |
| Assyrians/Chaldeans/Syriacs | 24.6 /100 | #197 | Fair $39,159 |
| Ecuadorians | 23.0 /100 | #198 | Fair $39,117 |
| Icelanders | 22.7 /100 | #199 | Fair $39,109 |
| Immigrants | Panama | 20.6 /100 | #200 | Fair $39,049 |
Demographics Similar to Maltese by Median Female Earnings
In terms of median female earnings, the demographic groups most similar to Maltese are Immigrants from Uzbekistan ($43,363, a difference of 0.010%), Immigrants from Serbia ($43,385, a difference of 0.060%), Immigrants from Lithuania ($43,317, a difference of 0.090%), Immigrants from Eastern Europe ($43,309, a difference of 0.11%), and Australian ($43,308, a difference of 0.11%).
| Demographics | Rating | Rank | Median Female Earnings |
| Immigrants | Czechoslovakia | 100.0 /100 | #44 | Exceptional $43,571 |
| Immigrants | Europe | 100.0 /100 | #45 | Exceptional $43,523 |
| Immigrants | Bolivia | 100.0 /100 | #46 | Exceptional $43,467 |
| Bolivians | 100.0 /100 | #47 | Exceptional $43,445 |
| Immigrants | Indonesia | 100.0 /100 | #48 | Exceptional $43,412 |
| Immigrants | Serbia | 100.0 /100 | #49 | Exceptional $43,385 |
| Immigrants | Uzbekistan | 100.0 /100 | #50 | Exceptional $43,363 |
| Maltese | 100.0 /100 | #51 | Exceptional $43,357 |
| Immigrants | Lithuania | 99.9 /100 | #52 | Exceptional $43,317 |
| Immigrants | Eastern Europe | 99.9 /100 | #53 | Exceptional $43,309 |
| Australians | 99.9 /100 | #54 | Exceptional $43,308 |
| Egyptians | 99.9 /100 | #55 | Exceptional $43,305 |
| Immigrants | Croatia | 99.9 /100 | #56 | Exceptional $43,258 |
| Ethiopians | 99.9 /100 | #57 | Exceptional $43,243 |
| Paraguayans | 99.9 /100 | #58 | Exceptional $43,173 |