Cajun vs Maltese In Labor Force | Age 25-29
COMPARE
Cajun
Maltese
In Labor Force | Age 25-29
In Labor Force | Age 25-29 Comparison
Cajuns
Maltese
82.5%
IN LABOR FORCE | AGE 25-29
0.0/ 100
METRIC RATING
307th/ 347
METRIC RANK
86.0%
IN LABOR FORCE | AGE 25-29
100.0/ 100
METRIC RATING
21st/ 347
METRIC RANK
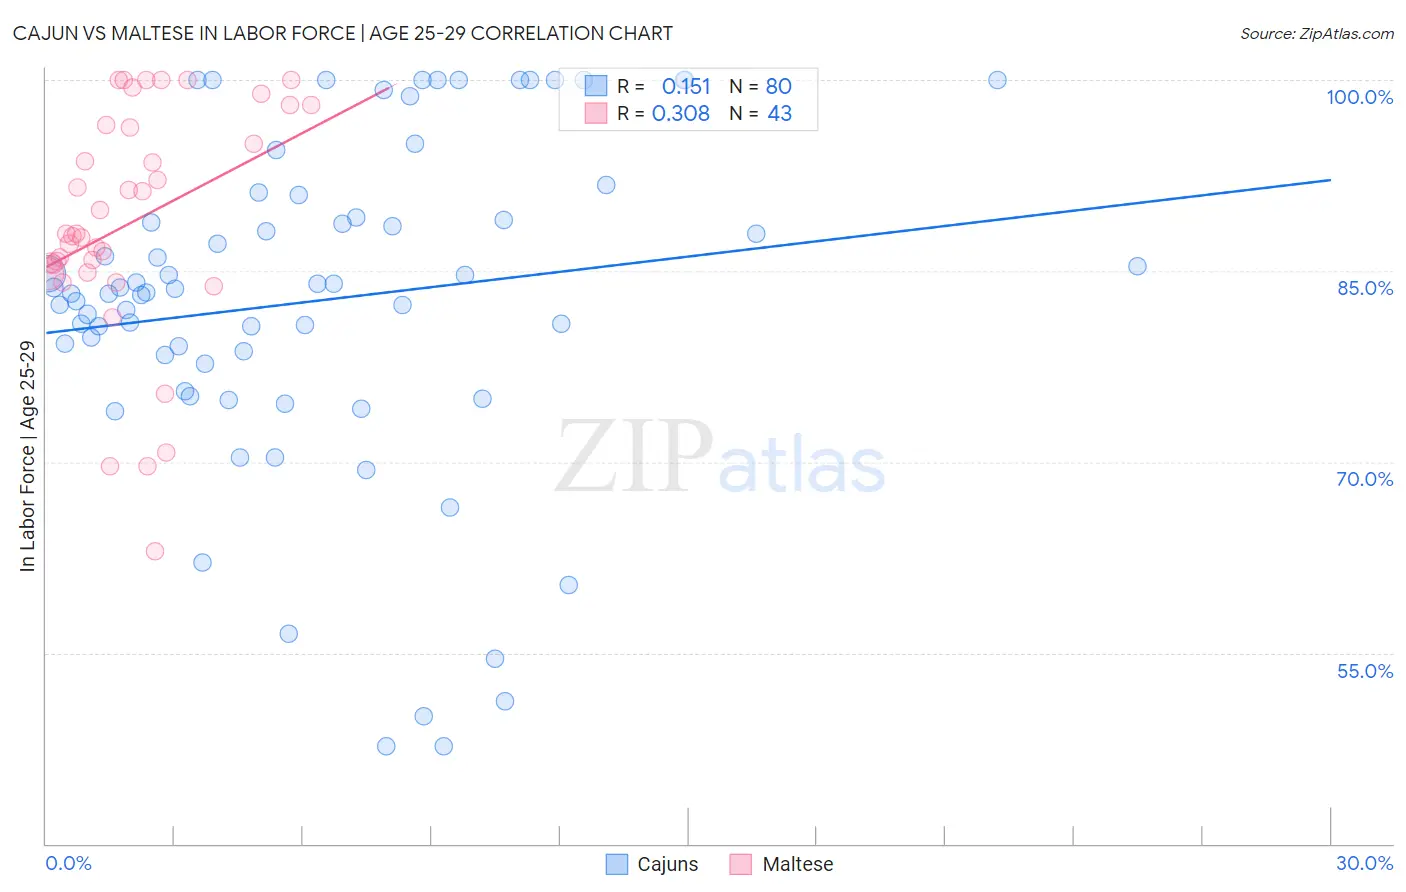
Cajun vs Maltese In Labor Force | Age 25-29 Correlation Chart
The statistical analysis conducted on geographies consisting of 149,675,482 people shows a poor positive correlation between the proportion of Cajuns and labor force participation rate among population between the ages 25 and 29 in the United States with a correlation coefficient (R) of 0.151 and weighted average of 82.5%. Similarly, the statistical analysis conducted on geographies consisting of 126,432,251 people shows a mild positive correlation between the proportion of Maltese and labor force participation rate among population between the ages 25 and 29 in the United States with a correlation coefficient (R) of 0.308 and weighted average of 86.0%, a difference of 4.2%.
In Labor Force | Age 25-29 Correlation Summary
| Measurement | Cajun | Maltese |
| Minimum | 47.7% | 63.0% |
| Maximum | 100.0% | 100.0% |
| Range | 52.3% | 37.0% |
| Mean | 82.7% | 88.8% |
| Median | 83.4% | 87.9% |
| Interquartile 25% (IQ1) | 78.0% | 84.9% |
| Interquartile 75% (IQ3) | 90.1% | 96.5% |
| Interquartile Range (IQR) | 12.1% | 11.6% |
| Standard Deviation (Sample) | 13.1% | 9.1% |
| Standard Deviation (Population) | 13.0% | 9.0% |
Similar Demographics by In Labor Force | Age 25-29
Demographics Similar to Cajuns by In Labor Force | Age 25-29
In terms of in labor force | age 25-29, the demographic groups most similar to Cajuns are Black/African American (82.6%, a difference of 0.060%), Blackfeet (82.6%, a difference of 0.060%), Central American Indian (82.4%, a difference of 0.15%), Immigrants from Central America (82.4%, a difference of 0.16%), and Immigrants from St. Vincent and the Grenadines (82.7%, a difference of 0.18%).
| Demographics | Rating | Rank | In Labor Force | Age 25-29 |
| Spanish American Indians | 0.0 /100 | #300 | Tragic 82.9% |
| Vietnamese | 0.0 /100 | #301 | Tragic 82.8% |
| Immigrants | Belize | 0.0 /100 | #302 | Tragic 82.8% |
| Immigrants | Grenada | 0.0 /100 | #303 | Tragic 82.8% |
| Immigrants | St. Vincent and the Grenadines | 0.0 /100 | #304 | Tragic 82.7% |
| Blacks/African Americans | 0.0 /100 | #305 | Tragic 82.6% |
| Blackfeet | 0.0 /100 | #306 | Tragic 82.6% |
| Cajuns | 0.0 /100 | #307 | Tragic 82.5% |
| Central American Indians | 0.0 /100 | #308 | Tragic 82.4% |
| Immigrants | Central America | 0.0 /100 | #309 | Tragic 82.4% |
| Osage | 0.0 /100 | #310 | Tragic 82.3% |
| Alaskan Athabascans | 0.0 /100 | #311 | Tragic 82.3% |
| Hispanics or Latinos | 0.0 /100 | #312 | Tragic 82.2% |
| Yaqui | 0.0 /100 | #313 | Tragic 82.2% |
| Cherokee | 0.0 /100 | #314 | Tragic 82.1% |
Demographics Similar to Maltese by In Labor Force | Age 25-29
In terms of in labor force | age 25-29, the demographic groups most similar to Maltese are Immigrants from Ireland (86.0%, a difference of 0.010%), Cambodian (86.0%, a difference of 0.010%), Cape Verdean (86.0%, a difference of 0.020%), Bulgarian (86.0%, a difference of 0.030%), and Immigrants from Uganda (86.0%, a difference of 0.030%).
| Demographics | Rating | Rank | In Labor Force | Age 25-29 |
| Latvians | 100.0 /100 | #14 | Exceptional 86.1% |
| Bolivians | 100.0 /100 | #15 | Exceptional 86.1% |
| Immigrants | Bolivia | 100.0 /100 | #16 | Exceptional 86.1% |
| Bermudans | 100.0 /100 | #17 | Exceptional 86.0% |
| Bulgarians | 100.0 /100 | #18 | Exceptional 86.0% |
| Cape Verdeans | 100.0 /100 | #19 | Exceptional 86.0% |
| Immigrants | Ireland | 100.0 /100 | #20 | Exceptional 86.0% |
| Maltese | 100.0 /100 | #21 | Exceptional 86.0% |
| Cambodians | 100.0 /100 | #22 | Exceptional 86.0% |
| Immigrants | Uganda | 100.0 /100 | #23 | Exceptional 86.0% |
| Immigrants | Eastern Africa | 100.0 /100 | #24 | Exceptional 86.0% |
| Sudanese | 100.0 /100 | #25 | Exceptional 85.9% |
| Immigrants | North Macedonia | 100.0 /100 | #26 | Exceptional 85.9% |
| Paraguayans | 100.0 /100 | #27 | Exceptional 85.9% |
| Ugandans | 100.0 /100 | #28 | Exceptional 85.9% |