Eastern European vs Maltese Median Female Earnings

COMPARE

Eastern European
Race
Ancestry
AfghanAfricanAlaska NativeAlaskan AthabascanAlbanianAleutAlsatianAmericanApacheArabArapahoArgentineanArmenianAssyrian/Chaldean/SyriacAustralianAustrianBahamianBangladeshiBarbadianBasqueBelgianBelizeanBermudanBhutaneseBlackfeetBolivianBrazilianBritishBritish West IndianBulgarianBurmeseCajunCambodianCanadianCape VerdeanCarpatho RusynCelticCentral AmericanCentral American IndianCherokeeCheyenneChickasawChileanChineseChippewaChoctawColombianColvilleComancheCosta RicanCreeCreekCroatianCrowCubanCypriotCzechCzechoslovakianDanishDelawareDominicanDutchDutch West IndianEastern EuropeanEcuadorianEgyptianEnglishEstonianEthiopianEuropeanFijianFilipinoFinnishFrenchFrench American IndianFrench CanadianGermanGerman RussianGhanaianGreekGuamanian/ChamorroGuatemalanGuyaneseHaitianHmongHonduranHopiHoumaHungarianIcelanderIndian (Asian)IndonesianInupiatIranianIraqiIrishIroquoisIsraeliItalianJamaicanJapaneseJordanianKenyanKiowaKoreanLaotianLatvianLebaneseLiberianLithuanianLumbeeLuxembourgerMacedonianMalaysianMarshalleseMenomineeMexicanMexican American IndianMongolianMoroccanNative HawaiianNavajoNepaleseNew ZealanderNicaraguanNigerianNorthern EuropeanNorwegianOkinawanOsageOttawaPaiutePakistaniPalestinianPanamanianParaguayanPennsylvania GermanPeruvianPimaPolishPortuguesePotawatomiPuebloPuerto RicanPuget Sound SalishRomanianRussianSalvadoranSamoanScandinavianScotch-IrishScottishSeminoleSenegaleseSerbianShoshoneSierra LeoneanSiouxSlavicSlovakSloveneSomaliSouth AfricanSouth AmericanSouth American IndianSoviet UnionSpaniardSpanishSpanish AmericanSpanish American IndianSri LankanSubsaharan AfricanSudaneseSwedishSwissSyrianTaiwaneseThaiTlingit-HaidaTohono O'OdhamTonganTrinidadian and TobagonianTsimshianTurkishU.S. Virgin IslanderUgandanUkrainianUruguayanUteVenezuelanVietnameseWelshWest IndianYakamaYaquiYugoslavianYumanYup'ikZimbabwean
Immigration
NonimmigrantsImmigrantsAfghanistanAfricaAlbaniaArgentinaArmeniaAsiaAustraliaAustriaBahamasBangladeshBarbadosBelarusBelgiumBelizeBoliviaBosnia and HerzegovinaBrazilBulgariaBurma/MyanmarCabo VerdeCambodiaCameroonCanadaCaribbeanCentral AmericaChileChinaColombiaCongoCosta RicaCroatiaCubaCzechoslovakiaDenmarkDominicaDominican RepublicEastern AfricaEastern AsiaEastern EuropeEcuadorEgyptEl SalvadorEnglandEritreaEthiopiaEuropeFijiFranceGermanyGhanaGreeceGrenadaGuatemalaGuyanaHaitiHondurasHong KongHungaryIndiaIndonesiaIranIraqIrelandIsraelItalyJamaicaJapanJordanKazakhstanKenyaKoreaKuwaitLaosLatin AmericaLatviaLebanonLiberiaLithuaniaMalaysiaMexicoMicronesiaMiddle AfricaMoldovaMoroccoNepalNetherlandsNicaraguaNigeriaNorth AmericaNorth MacedoniaNorthern AfricaNorthern EuropeNorwayOceaniaPakistanPanamaPeruPhilippinesPolandPortugalRomaniaRussiaSaudi ArabiaScotlandSenegalSerbiaSierra LeoneSingaporeSomaliaSouth AfricaSouth AmericaSouth Central AsiaSouth Eastern AsiaSouthern EuropeSpainSri LankaSt. Vincent and the GrenadinesSudanSwedenSwitzerlandSyriaTaiwanThailandTrinidad and TobagoTurkeyUgandaUkraineUruguayUzbekistanVenezuelaVietnamWest IndiesWestern AfricaWestern AsiaWestern EuropeYemenZaireZimbabweAzores
Maltese
Race
Ancestry
AfghanAfricanAlaska NativeAlaskan AthabascanAlbanianAleutAlsatianAmericanApacheArabArapahoArgentineanArmenianAssyrian/Chaldean/SyriacAustralianAustrianBahamianBangladeshiBarbadianBasqueBelgianBelizeanBermudanBhutaneseBlackfeetBolivianBrazilianBritishBritish West IndianBulgarianBurmeseCajunCambodianCanadianCape VerdeanCarpatho RusynCelticCentral AmericanCentral American IndianCherokeeCheyenneChickasawChileanChineseChippewaChoctawColombianColvilleComancheCosta RicanCreeCreekCroatianCrowCubanCypriotCzechCzechoslovakianDanishDelawareDominicanDutchDutch West IndianEcuadorianEgyptianEnglishEstonianEthiopianEuropeanFijianFilipinoFinnishFrenchFrench American IndianFrench CanadianGermanGerman RussianGhanaianGreekGuamanian/ChamorroGuatemalanGuyaneseHaitianHmongHonduranHopiHoumaHungarianIcelanderIndian (Asian)IndonesianInupiatIranianIraqiIrishIroquoisIsraeliItalianJamaicanJapaneseJordanianKenyanKiowaKoreanLaotianLatvianLebaneseLiberianLithuanianLumbeeLuxembourgerMacedonianMalaysianMalteseMarshalleseMenomineeMexicanMexican American IndianMongolianMoroccanNative HawaiianNavajoNepaleseNew ZealanderNicaraguanNigerianNorthern EuropeanNorwegianOkinawanOsageOttawaPaiutePakistaniPalestinianPanamanianParaguayanPennsylvania GermanPeruvianPimaPolishPortuguesePotawatomiPuebloPuerto RicanPuget Sound SalishRomanianRussianSalvadoranSamoanScandinavianScotch-IrishScottishSeminoleSenegaleseSerbianShoshoneSierra LeoneanSiouxSlavicSlovakSloveneSomaliSouth AfricanSouth AmericanSouth American IndianSoviet UnionSpaniardSpanishSpanish AmericanSpanish American IndianSri LankanSubsaharan AfricanSudaneseSwedishSwissSyrianTaiwaneseThaiTlingit-HaidaTohono O'OdhamTonganTrinidadian and TobagonianTsimshianTurkishU.S. Virgin IslanderUgandanUkrainianUruguayanUteVenezuelanVietnameseWelshWest IndianYakamaYaquiYugoslavianYumanYup'ikZimbabwean
Immigration
NonimmigrantsImmigrantsAfghanistanAfricaAlbaniaArgentinaArmeniaAsiaAustraliaAustriaBahamasBangladeshBarbadosBelarusBelgiumBelizeBoliviaBosnia and HerzegovinaBrazilBulgariaBurma/MyanmarCabo VerdeCambodiaCameroonCanadaCaribbeanCentral AmericaChileChinaColombiaCongoCosta RicaCroatiaCubaCzechoslovakiaDenmarkDominicaDominican RepublicEastern AfricaEastern AsiaEastern EuropeEcuadorEgyptEl SalvadorEnglandEritreaEthiopiaEuropeFijiFranceGermanyGhanaGreeceGrenadaGuatemalaGuyanaHaitiHondurasHong KongHungaryIndiaIndonesiaIranIraqIrelandIsraelItalyJamaicaJapanJordanKazakhstanKenyaKoreaKuwaitLaosLatin AmericaLatviaLebanonLiberiaLithuaniaMalaysiaMexicoMicronesiaMiddle AfricaMoldovaMoroccoNepalNetherlandsNicaraguaNigeriaNorth AmericaNorth MacedoniaNorthern AfricaNorthern EuropeNorwayOceaniaPakistanPanamaPeruPhilippinesPolandPortugalRomaniaRussiaSaudi ArabiaScotlandSenegalSerbiaSierra LeoneSingaporeSomaliaSouth AfricaSouth AmericaSouth Central AsiaSouth Eastern AsiaSouthern EuropeSpainSri LankaSt. Vincent and the GrenadinesSudanSwedenSwitzerlandSyriaTaiwanThailandTrinidad and TobagoTurkeyUgandaUkraineUruguayUzbekistanVenezuelaVietnamWest IndiesWestern AfricaWestern AsiaWestern EuropeYemenZaireZimbabweAzores
Median Female Earnings
Income
Poverty
Unemployment
Labor Participation
Family Structure
Vehicle Availability
Education Level
Disability

Median Female Earnings Comparison

Eastern Europeans

Maltese

Exceptional
Exceptional
$45,385
MEDIAN FEMALE EARNINGS
100.0/ 100
METRIC RATING
19th/ 347
METRIC RANK
$43,357
MEDIAN FEMALE EARNINGS
100.0/ 100
METRIC RATING
51st/ 347
METRIC RANK

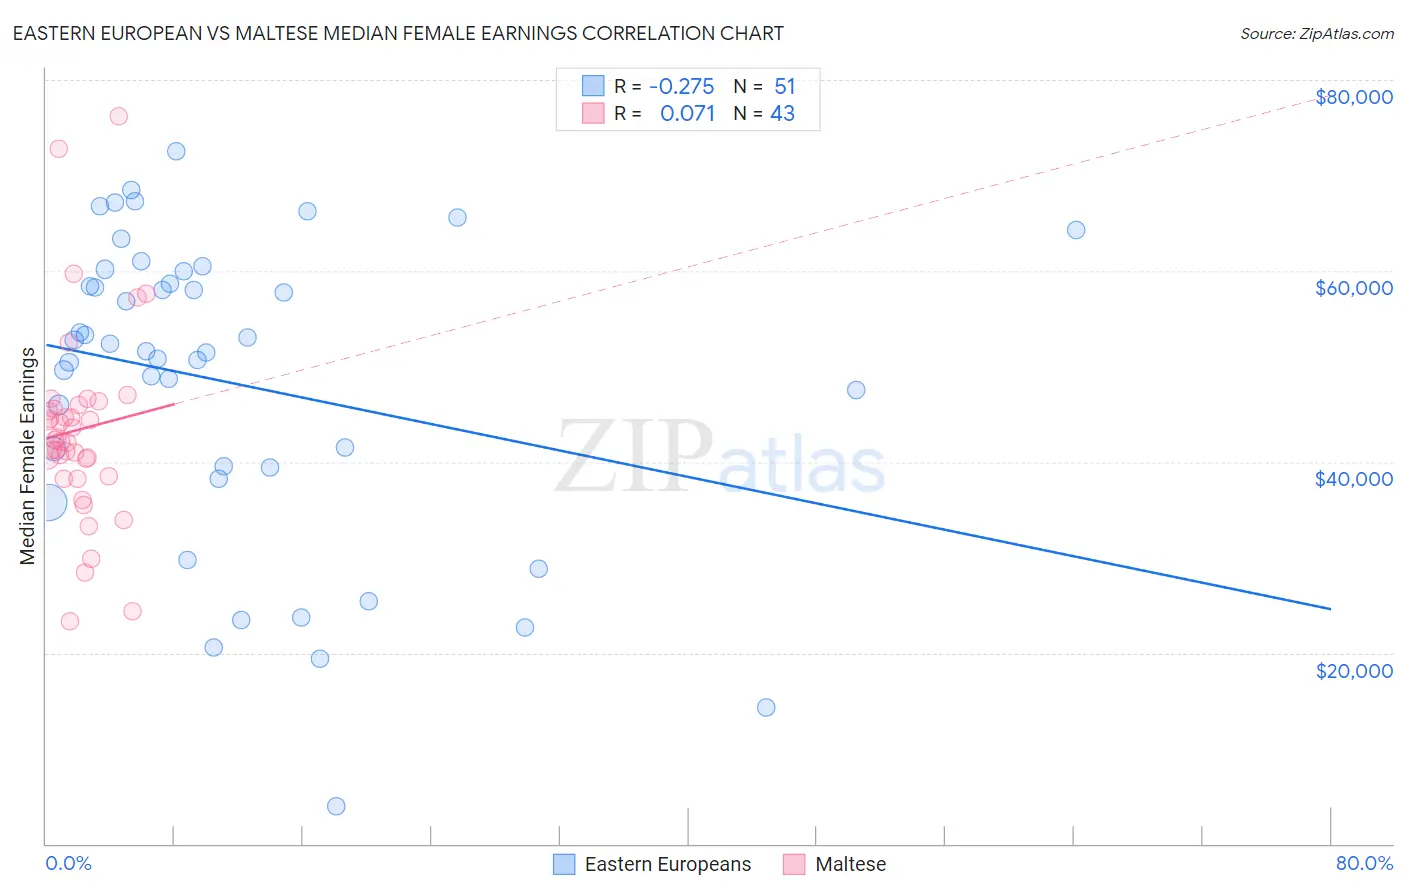
Eastern European vs Maltese Median Female Earnings Correlation Chart

The statistical analysis conducted on geographies consisting of 460,854,647 people shows a weak negative correlation between the proportion of Eastern Europeans and median female earnings in the United States with a correlation coefficient (R) of -0.275 and weighted average of $45,385. Similarly, the statistical analysis conducted on geographies consisting of 126,447,525 people shows a slight positive correlation between the proportion of Maltese and median female earnings in the United States with a correlation coefficient (R) of 0.071 and weighted average of $43,357, a difference of 4.7%.
Eastern European vs Maltese Median Female Earnings

Median Female Earnings Correlation Summary

MeasurementEastern EuropeanMaltese
Minimum$3,984$23,250
Maximum$72,541$76,250
Range$68,557$53,000
Mean$48,179$43,370
Median$51,543$42,338
Interquartile 25% (IQ1)$39,388$38,447
Interquartile 75% (IQ3)$59,979$45,921
Interquartile Range (IQR)$20,591$7,474
Standard Deviation (Sample)$16,076$10,204
Standard Deviation (Population)$15,918$10,085

Similar Demographics by Median Female Earnings

Demographics Similar to Eastern Europeans by Median Female Earnings

In terms of median female earnings, the demographic groups most similar to Eastern Europeans are Immigrants from Japan ($45,323, a difference of 0.14%), Cypriot ($45,570, a difference of 0.41%), Cambodian ($45,014, a difference of 0.82%), Immigrants from Greece ($44,976, a difference of 0.91%), and Burmese ($44,911, a difference of 1.1%).
DemographicsRating | RankMedian Female Earnings
Immigrants | Israel
100.0
/100
|
#12
Exceptional
$46,902
Immigrants | Australia
100.0
/100
|
#13
Exceptional
$46,573
Soviet Union
100.0
/100
|
#14
Exceptional
$46,556
Immigrants | Eastern Asia
100.0
/100
|
#15
Exceptional
$46,502
Indians (Asian)
100.0
/100
|
#16
Exceptional
$46,481
Immigrants | South Central Asia
100.0
/100
|
#17
Exceptional
$46,324
Cypriots
100.0
/100
|
#18
Exceptional
$45,570
Eastern Europeans
100.0
/100
|
#19
Exceptional
$45,385
Immigrants | Japan
100.0
/100
|
#20
Exceptional
$45,323
Cambodians
100.0
/100
|
#21
Exceptional
$45,014
Immigrants | Greece
100.0
/100
|
#22
Exceptional
$44,976
Burmese
100.0
/100
|
#23
Exceptional
$44,911
Immigrants | Korea
100.0
/100
|
#24
Exceptional
$44,847
Immigrants | Sweden
100.0
/100
|
#25
Exceptional
$44,774
Immigrants | Belarus
100.0
/100
|
#26
Exceptional
$44,757

Demographics Similar to Maltese by Median Female Earnings

In terms of median female earnings, the demographic groups most similar to Maltese are Immigrants from Uzbekistan ($43,363, a difference of 0.010%), Immigrants from Serbia ($43,385, a difference of 0.060%), Immigrants from Lithuania ($43,317, a difference of 0.090%), Immigrants from Eastern Europe ($43,309, a difference of 0.11%), and Australian ($43,308, a difference of 0.11%).
DemographicsRating | RankMedian Female Earnings
Immigrants | Czechoslovakia
100.0
/100
|
#44
Exceptional
$43,571
Immigrants | Europe
100.0
/100
|
#45
Exceptional
$43,523
Immigrants | Bolivia
100.0
/100
|
#46
Exceptional
$43,467
Bolivians
100.0
/100
|
#47
Exceptional
$43,445
Immigrants | Indonesia
100.0
/100
|
#48
Exceptional
$43,412
Immigrants | Serbia
100.0
/100
|
#49
Exceptional
$43,385
Immigrants | Uzbekistan
100.0
/100
|
#50
Exceptional
$43,363
Maltese
100.0
/100
|
#51
Exceptional
$43,357
Immigrants | Lithuania
99.9
/100
|
#52
Exceptional
$43,317
Immigrants | Eastern Europe
99.9
/100
|
#53
Exceptional
$43,309
Australians
99.9
/100
|
#54
Exceptional
$43,308
Egyptians
99.9
/100
|
#55
Exceptional
$43,305
Immigrants | Croatia
99.9
/100
|
#56
Exceptional
$43,258
Ethiopians
99.9
/100
|
#57
Exceptional
$43,243
Paraguayans
99.9
/100
|
#58
Exceptional
$43,173