Danish vs Immigrants from Somalia Median Female Earnings
COMPARE
Danish
Immigrants from Somalia
Median Female Earnings
Median Female Earnings Comparison
Danes
Immigrants from Somalia
$37,730
MEDIAN FEMALE EARNINGS
1.6/ 100
METRIC RATING
253rd/ 347
METRIC RANK
$37,914
MEDIAN FEMALE EARNINGS
2.4/ 100
METRIC RATING
247th/ 347
METRIC RANK
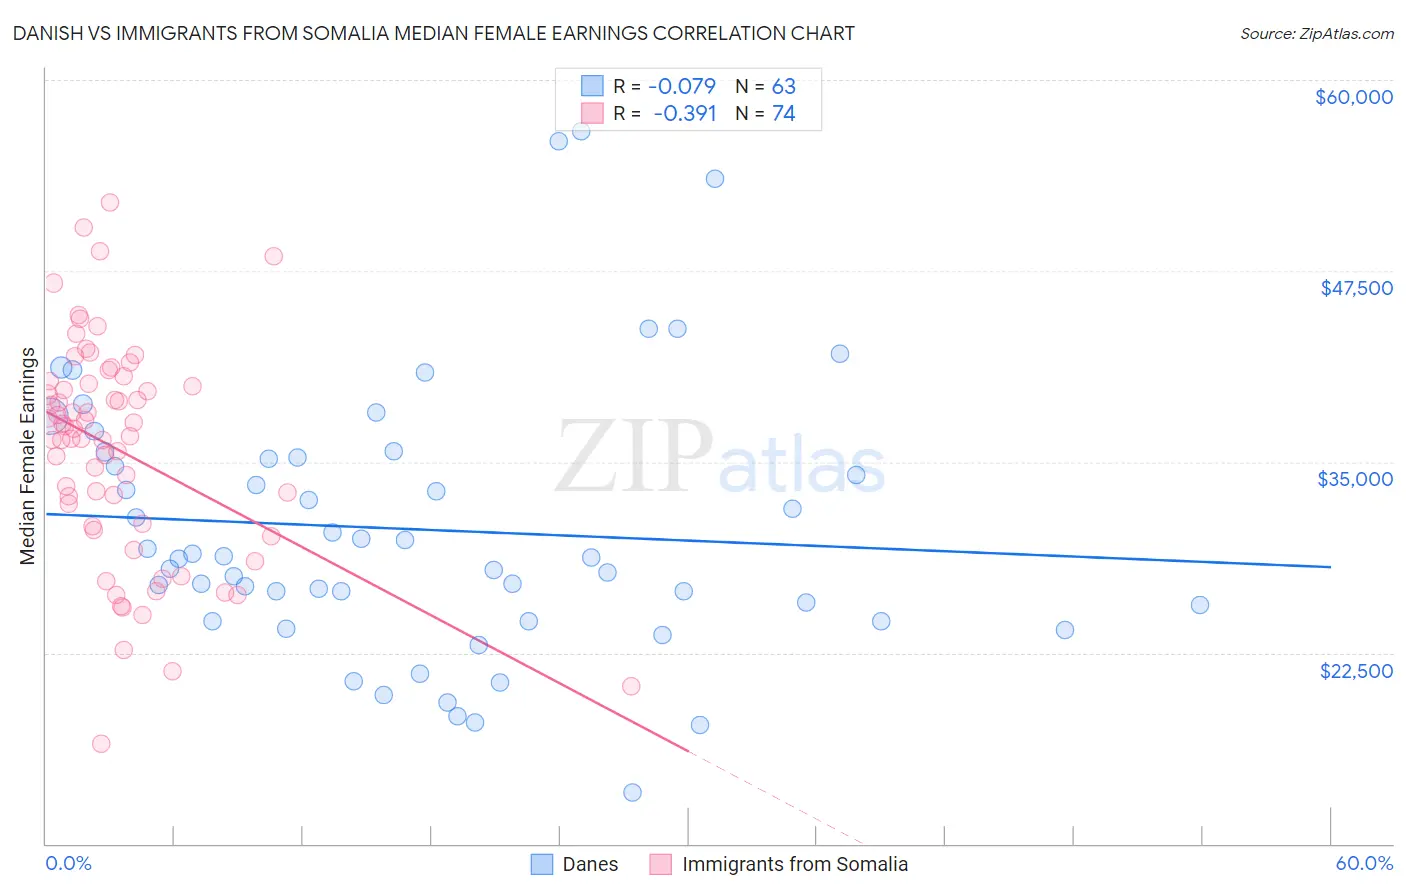
Danish vs Immigrants from Somalia Median Female Earnings Correlation Chart
The statistical analysis conducted on geographies consisting of 473,573,147 people shows a slight negative correlation between the proportion of Danes and median female earnings in the United States with a correlation coefficient (R) of -0.079 and weighted average of $37,730. Similarly, the statistical analysis conducted on geographies consisting of 92,105,737 people shows a mild negative correlation between the proportion of Immigrants from Somalia and median female earnings in the United States with a correlation coefficient (R) of -0.391 and weighted average of $37,914, a difference of 0.49%.
Median Female Earnings Correlation Summary
| Measurement | Danish | Immigrants from Somalia |
| Minimum | $13,388 | $16,542 |
| Maximum | $56,667 | $51,945 |
| Range | $43,279 | $35,403 |
| Mean | $30,568 | $35,740 |
| Median | $28,750 | $36,925 |
| Interquartile 25% (IQ1) | $24,607 | $30,785 |
| Interquartile 75% (IQ3) | $35,286 | $40,139 |
| Interquartile Range (IQR) | $10,679 | $9,354 |
| Standard Deviation (Sample) | $8,841 | $7,218 |
| Standard Deviation (Population) | $8,771 | $7,169 |
Demographics Similar to Danes and Immigrants from Somalia by Median Female Earnings
In terms of median female earnings, the demographic groups most similar to Danes are Immigrants from Dominica ($37,825, a difference of 0.25%), Welsh ($37,856, a difference of 0.33%), Immigrants from Iraq ($37,864, a difference of 0.35%), Alaskan Athabascan ($37,905, a difference of 0.46%), and Swiss ($37,904, a difference of 0.46%). Similarly, the demographic groups most similar to Immigrants from Somalia are Alaskan Athabascan ($37,905, a difference of 0.020%), Swiss ($37,904, a difference of 0.030%), Delaware ($37,964, a difference of 0.13%), Immigrants from Iraq ($37,864, a difference of 0.13%), and Immigrants from Middle Africa ($37,965, a difference of 0.14%).
| Demographics | Rating | Rank | Median Female Earnings |
| Finns | 4.0 /100 | #240 | Tragic $38,173 |
| Spanish | 3.5 /100 | #241 | Tragic $38,098 |
| Immigrants | Burma/Myanmar | 3.0 /100 | #242 | Tragic $38,028 |
| Germans | 2.8 /100 | #243 | Tragic $37,986 |
| Immigrants | Liberia | 2.7 /100 | #244 | Tragic $37,970 |
| Immigrants | Middle Africa | 2.7 /100 | #245 | Tragic $37,965 |
| Delaware | 2.6 /100 | #246 | Tragic $37,964 |
| Immigrants | Somalia | 2.4 /100 | #247 | Tragic $37,914 |
| Alaskan Athabascans | 2.3 /100 | #248 | Tragic $37,905 |
| Swiss | 2.3 /100 | #249 | Tragic $37,904 |
| Immigrants | Iraq | 2.2 /100 | #250 | Tragic $37,864 |
| Welsh | 2.1 /100 | #251 | Tragic $37,856 |
| Immigrants | Dominica | 2.0 /100 | #252 | Tragic $37,825 |
| Danes | 1.6 /100 | #253 | Tragic $37,730 |
| Whites/Caucasians | 1.1 /100 | #254 | Tragic $37,531 |
| Colville | 1.1 /100 | #255 | Tragic $37,514 |
| Samoans | 1.0 /100 | #256 | Tragic $37,498 |
| Hawaiians | 1.0 /100 | #257 | Tragic $37,497 |
| Belizeans | 0.9 /100 | #258 | Tragic $37,429 |
| Scotch-Irish | 0.8 /100 | #259 | Tragic $37,383 |
| Dutch | 0.7 /100 | #260 | Tragic $37,339 |