Immigrants from France vs Immigrants from Somalia Median Female Earnings
COMPARE
Immigrants from France
Immigrants from Somalia
Median Female Earnings
Median Female Earnings Comparison
Immigrants from France
Immigrants from Somalia
$44,541
MEDIAN FEMALE EARNINGS
100.0/ 100
METRIC RATING
31st/ 347
METRIC RANK
$37,914
MEDIAN FEMALE EARNINGS
2.4/ 100
METRIC RATING
247th/ 347
METRIC RANK
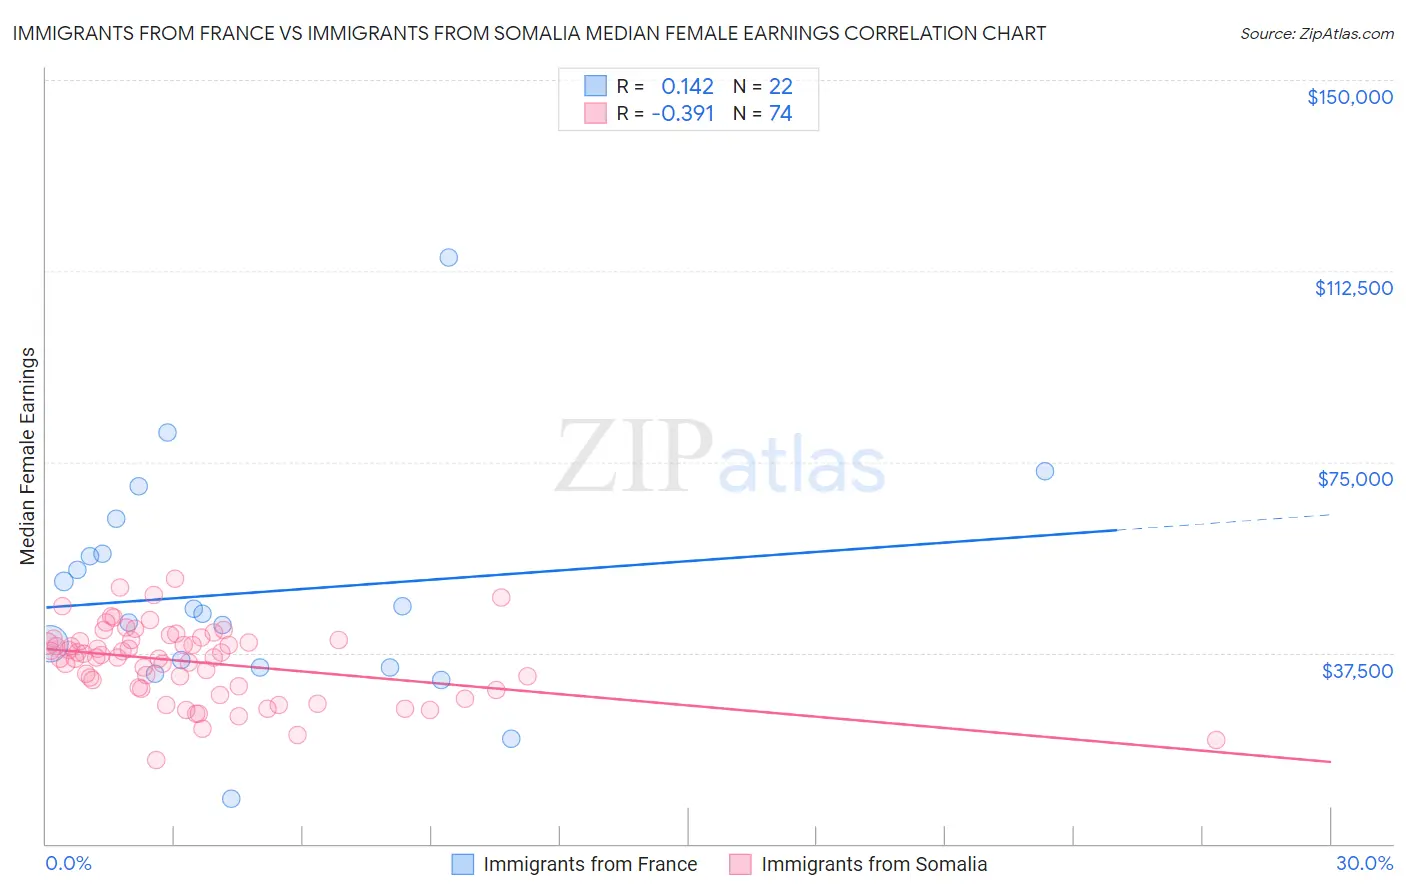
Immigrants from France vs Immigrants from Somalia Median Female Earnings Correlation Chart
The statistical analysis conducted on geographies consisting of 287,837,863 people shows a poor positive correlation between the proportion of Immigrants from France and median female earnings in the United States with a correlation coefficient (R) of 0.142 and weighted average of $44,541. Similarly, the statistical analysis conducted on geographies consisting of 92,105,737 people shows a mild negative correlation between the proportion of Immigrants from Somalia and median female earnings in the United States with a correlation coefficient (R) of -0.391 and weighted average of $37,914, a difference of 17.5%.
Median Female Earnings Correlation Summary
| Measurement | Immigrants from France | Immigrants from Somalia |
| Minimum | $8,878 | $16,542 |
| Maximum | $115,017 | $51,945 |
| Range | $106,139 | $35,403 |
| Mean | $49,372 | $35,740 |
| Median | $45,659 | $36,925 |
| Interquartile 25% (IQ1) | $34,701 | $30,785 |
| Interquartile 75% (IQ3) | $56,964 | $40,139 |
| Interquartile Range (IQR) | $22,263 | $9,354 |
| Standard Deviation (Sample) | $22,329 | $7,218 |
| Standard Deviation (Population) | $21,816 | $7,169 |
Similar Demographics by Median Female Earnings
Demographics Similar to Immigrants from France by Median Female Earnings
In terms of median female earnings, the demographic groups most similar to Immigrants from France are Immigrants from Belgium ($44,587, a difference of 0.10%), Asian ($44,586, a difference of 0.10%), Immigrants from Russia ($44,680, a difference of 0.31%), Turkish ($44,695, a difference of 0.34%), and Immigrants from Northern Europe ($44,366, a difference of 0.40%).
| Demographics | Rating | Rank | Median Female Earnings |
| Immigrants | Korea | 100.0 /100 | #24 | Exceptional $44,847 |
| Immigrants | Sweden | 100.0 /100 | #25 | Exceptional $44,774 |
| Immigrants | Belarus | 100.0 /100 | #26 | Exceptional $44,757 |
| Turks | 100.0 /100 | #27 | Exceptional $44,695 |
| Immigrants | Russia | 100.0 /100 | #28 | Exceptional $44,680 |
| Immigrants | Belgium | 100.0 /100 | #29 | Exceptional $44,587 |
| Asians | 100.0 /100 | #30 | Exceptional $44,586 |
| Immigrants | France | 100.0 /100 | #31 | Exceptional $44,541 |
| Immigrants | Northern Europe | 100.0 /100 | #32 | Exceptional $44,366 |
| Immigrants | Asia | 100.0 /100 | #33 | Exceptional $44,198 |
| Russians | 100.0 /100 | #34 | Exceptional $44,169 |
| Immigrants | Sri Lanka | 100.0 /100 | #35 | Exceptional $44,161 |
| Immigrants | Turkey | 100.0 /100 | #36 | Exceptional $44,066 |
| Immigrants | Switzerland | 100.0 /100 | #37 | Exceptional $43,996 |
| Latvians | 100.0 /100 | #38 | Exceptional $43,941 |
Demographics Similar to Immigrants from Somalia by Median Female Earnings
In terms of median female earnings, the demographic groups most similar to Immigrants from Somalia are Alaskan Athabascan ($37,905, a difference of 0.020%), Swiss ($37,904, a difference of 0.030%), Delaware ($37,964, a difference of 0.13%), Immigrants from Iraq ($37,864, a difference of 0.13%), and Immigrants from Middle Africa ($37,965, a difference of 0.14%).
| Demographics | Rating | Rank | Median Female Earnings |
| Finns | 4.0 /100 | #240 | Tragic $38,173 |
| Spanish | 3.5 /100 | #241 | Tragic $38,098 |
| Immigrants | Burma/Myanmar | 3.0 /100 | #242 | Tragic $38,028 |
| Germans | 2.8 /100 | #243 | Tragic $37,986 |
| Immigrants | Liberia | 2.7 /100 | #244 | Tragic $37,970 |
| Immigrants | Middle Africa | 2.7 /100 | #245 | Tragic $37,965 |
| Delaware | 2.6 /100 | #246 | Tragic $37,964 |
| Immigrants | Somalia | 2.4 /100 | #247 | Tragic $37,914 |
| Alaskan Athabascans | 2.3 /100 | #248 | Tragic $37,905 |
| Swiss | 2.3 /100 | #249 | Tragic $37,904 |
| Immigrants | Iraq | 2.2 /100 | #250 | Tragic $37,864 |
| Welsh | 2.1 /100 | #251 | Tragic $37,856 |
| Immigrants | Dominica | 2.0 /100 | #252 | Tragic $37,825 |
| Danes | 1.6 /100 | #253 | Tragic $37,730 |
| Whites/Caucasians | 1.1 /100 | #254 | Tragic $37,531 |