Immigrants from Serbia vs Immigrants from Somalia Median Female Earnings
COMPARE
Immigrants from Serbia
Immigrants from Somalia
Median Female Earnings
Median Female Earnings Comparison
Immigrants from Serbia
Immigrants from Somalia
$43,385
MEDIAN FEMALE EARNINGS
100.0/ 100
METRIC RATING
49th/ 347
METRIC RANK
$37,914
MEDIAN FEMALE EARNINGS
2.4/ 100
METRIC RATING
247th/ 347
METRIC RANK
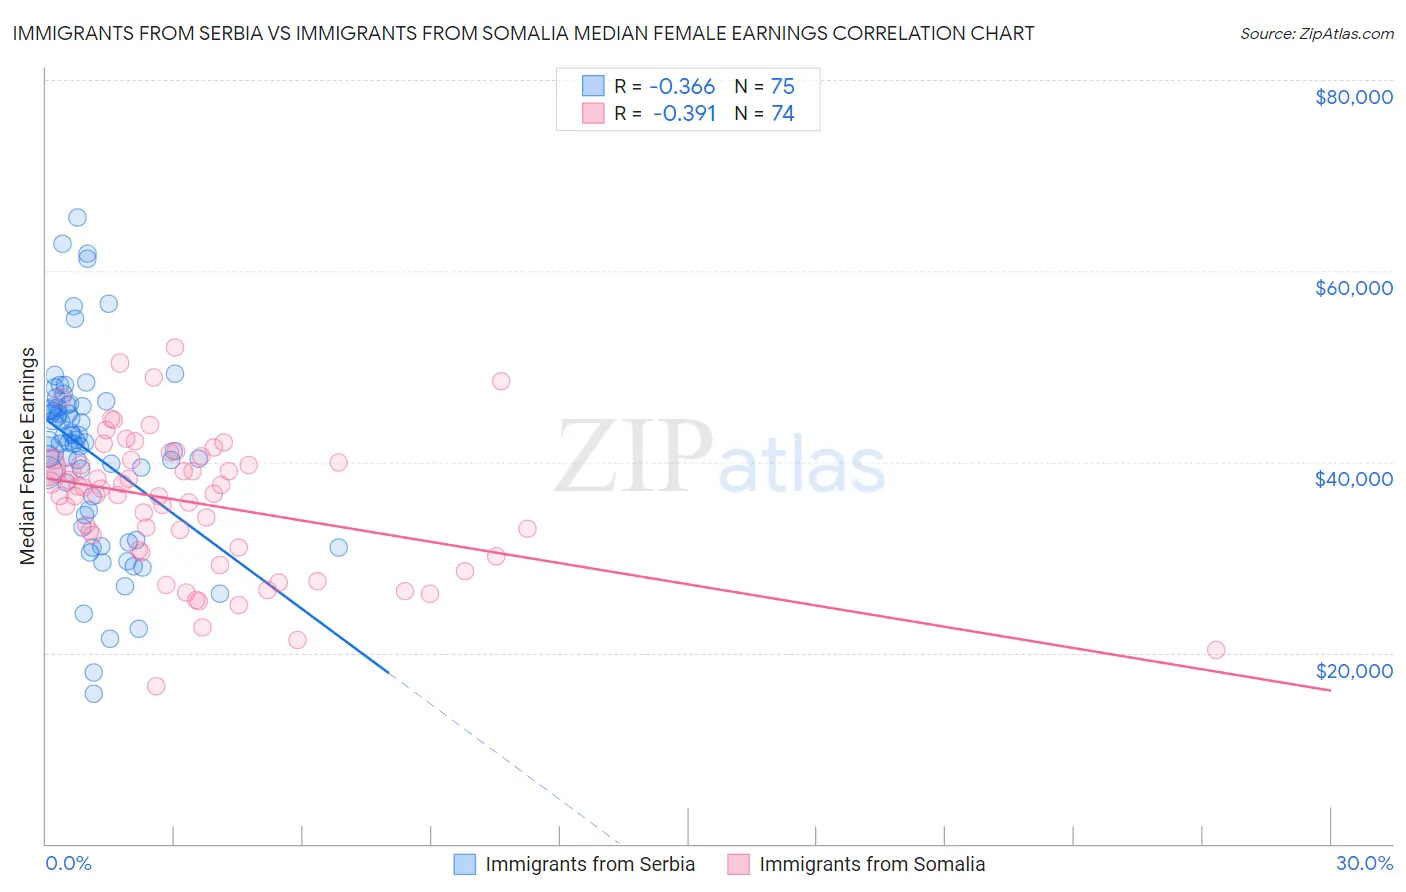
Immigrants from Serbia vs Immigrants from Somalia Median Female Earnings Correlation Chart
The statistical analysis conducted on geographies consisting of 131,728,260 people shows a mild negative correlation between the proportion of Immigrants from Serbia and median female earnings in the United States with a correlation coefficient (R) of -0.366 and weighted average of $43,385. Similarly, the statistical analysis conducted on geographies consisting of 92,105,737 people shows a mild negative correlation between the proportion of Immigrants from Somalia and median female earnings in the United States with a correlation coefficient (R) of -0.391 and weighted average of $37,914, a difference of 14.4%.
Median Female Earnings Correlation Summary
| Measurement | Immigrants from Serbia | Immigrants from Somalia |
| Minimum | $15,750 | $16,542 |
| Maximum | $65,545 | $51,945 |
| Range | $49,795 | $35,403 |
| Mean | $40,928 | $35,740 |
| Median | $42,089 | $36,925 |
| Interquartile 25% (IQ1) | $34,470 | $30,785 |
| Interquartile 75% (IQ3) | $45,867 | $40,139 |
| Interquartile Range (IQR) | $11,397 | $9,354 |
| Standard Deviation (Sample) | $9,877 | $7,218 |
| Standard Deviation (Population) | $9,811 | $7,169 |
Similar Demographics by Median Female Earnings
Demographics Similar to Immigrants from Serbia by Median Female Earnings
In terms of median female earnings, the demographic groups most similar to Immigrants from Serbia are Immigrants from Uzbekistan ($43,363, a difference of 0.050%), Immigrants from Indonesia ($43,412, a difference of 0.060%), Maltese ($43,357, a difference of 0.060%), Bolivian ($43,445, a difference of 0.14%), and Immigrants from Lithuania ($43,317, a difference of 0.16%).
| Demographics | Rating | Rank | Median Female Earnings |
| Immigrants | Denmark | 100.0 /100 | #42 | Exceptional $43,646 |
| Bulgarians | 100.0 /100 | #43 | Exceptional $43,638 |
| Immigrants | Czechoslovakia | 100.0 /100 | #44 | Exceptional $43,571 |
| Immigrants | Europe | 100.0 /100 | #45 | Exceptional $43,523 |
| Immigrants | Bolivia | 100.0 /100 | #46 | Exceptional $43,467 |
| Bolivians | 100.0 /100 | #47 | Exceptional $43,445 |
| Immigrants | Indonesia | 100.0 /100 | #48 | Exceptional $43,412 |
| Immigrants | Serbia | 100.0 /100 | #49 | Exceptional $43,385 |
| Immigrants | Uzbekistan | 100.0 /100 | #50 | Exceptional $43,363 |
| Maltese | 100.0 /100 | #51 | Exceptional $43,357 |
| Immigrants | Lithuania | 99.9 /100 | #52 | Exceptional $43,317 |
| Immigrants | Eastern Europe | 99.9 /100 | #53 | Exceptional $43,309 |
| Australians | 99.9 /100 | #54 | Exceptional $43,308 |
| Egyptians | 99.9 /100 | #55 | Exceptional $43,305 |
| Immigrants | Croatia | 99.9 /100 | #56 | Exceptional $43,258 |
Demographics Similar to Immigrants from Somalia by Median Female Earnings
In terms of median female earnings, the demographic groups most similar to Immigrants from Somalia are Alaskan Athabascan ($37,905, a difference of 0.020%), Swiss ($37,904, a difference of 0.030%), Delaware ($37,964, a difference of 0.13%), Immigrants from Iraq ($37,864, a difference of 0.13%), and Immigrants from Middle Africa ($37,965, a difference of 0.14%).
| Demographics | Rating | Rank | Median Female Earnings |
| Finns | 4.0 /100 | #240 | Tragic $38,173 |
| Spanish | 3.5 /100 | #241 | Tragic $38,098 |
| Immigrants | Burma/Myanmar | 3.0 /100 | #242 | Tragic $38,028 |
| Germans | 2.8 /100 | #243 | Tragic $37,986 |
| Immigrants | Liberia | 2.7 /100 | #244 | Tragic $37,970 |
| Immigrants | Middle Africa | 2.7 /100 | #245 | Tragic $37,965 |
| Delaware | 2.6 /100 | #246 | Tragic $37,964 |
| Immigrants | Somalia | 2.4 /100 | #247 | Tragic $37,914 |
| Alaskan Athabascans | 2.3 /100 | #248 | Tragic $37,905 |
| Swiss | 2.3 /100 | #249 | Tragic $37,904 |
| Immigrants | Iraq | 2.2 /100 | #250 | Tragic $37,864 |
| Welsh | 2.1 /100 | #251 | Tragic $37,856 |
| Immigrants | Dominica | 2.0 /100 | #252 | Tragic $37,825 |
| Danes | 1.6 /100 | #253 | Tragic $37,730 |
| Whites/Caucasians | 1.1 /100 | #254 | Tragic $37,531 |