British vs Czech College, 1 year or more
COMPARE
British
Czech
College, 1 year or more
College, 1 year or more Comparison
British
Czechs
62.3%
COLLEGE, 1 YEAR OR MORE
97.4/ 100
METRIC RATING
95th/ 347
METRIC RANK
60.6%
COLLEGE, 1 YEAR OR MORE
81.9/ 100
METRIC RATING
144th/ 347
METRIC RANK
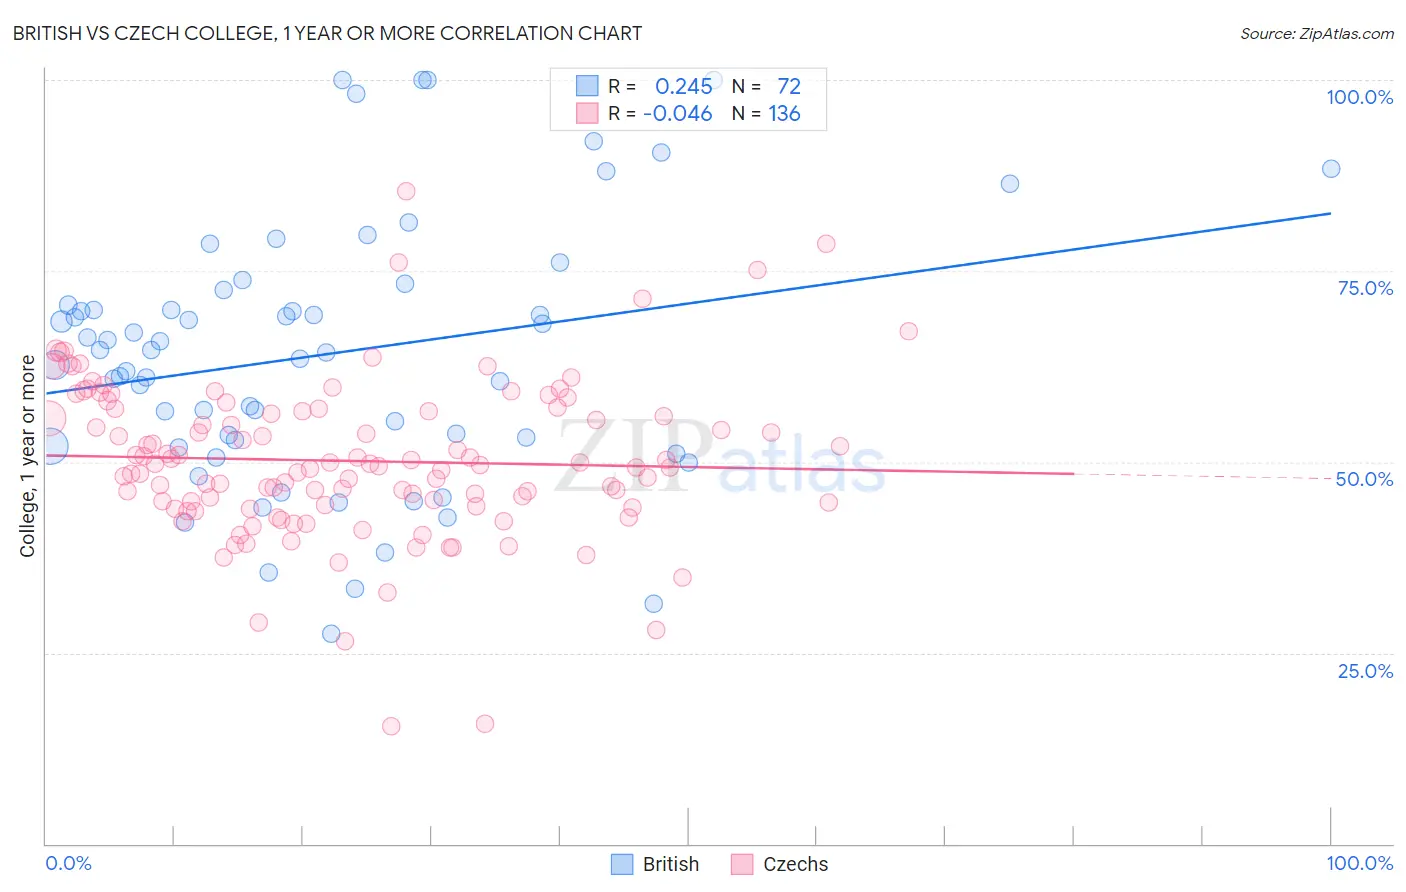
British vs Czech College, 1 year or more Correlation Chart
The statistical analysis conducted on geographies consisting of 531,458,915 people shows a weak positive correlation between the proportion of British and percentage of population with at least college, 1 year or more education in the United States with a correlation coefficient (R) of 0.245 and weighted average of 62.3%. Similarly, the statistical analysis conducted on geographies consisting of 484,810,404 people shows no correlation between the proportion of Czechs and percentage of population with at least college, 1 year or more education in the United States with a correlation coefficient (R) of -0.046 and weighted average of 60.6%, a difference of 2.8%.
College, 1 year or more Correlation Summary
| Measurement | British | Czech |
| Minimum | 27.5% | 15.4% |
| Maximum | 100.0% | 85.4% |
| Range | 72.5% | 70.0% |
| Mean | 64.1% | 50.1% |
| Median | 64.6% | 49.5% |
| Interquartile 25% (IQ1) | 52.5% | 44.3% |
| Interquartile 75% (IQ3) | 71.5% | 56.8% |
| Interquartile Range (IQR) | 19.0% | 12.5% |
| Standard Deviation (Sample) | 17.1% | 10.5% |
| Standard Deviation (Population) | 17.0% | 10.4% |
Similar Demographics by College, 1 year or more
Demographics Similar to British by College, 1 year or more
In terms of college, 1 year or more, the demographic groups most similar to British are Immigrants from Croatia (62.3%, a difference of 0.10%), Chinese (62.2%, a difference of 0.12%), Jordanian (62.2%, a difference of 0.12%), Carpatho Rusyn (62.2%, a difference of 0.12%), and Croatian (62.2%, a difference of 0.13%).
| Demographics | Rating | Rank | College, 1 year or more |
| Greeks | 98.3 /100 | #88 | Exceptional 62.6% |
| Immigrants | Ethiopia | 98.2 /100 | #89 | Exceptional 62.6% |
| Immigrants | Western Asia | 97.9 /100 | #90 | Exceptional 62.5% |
| Immigrants | Eastern Europe | 97.8 /100 | #91 | Exceptional 62.4% |
| Immigrants | Egypt | 97.8 /100 | #92 | Exceptional 62.4% |
| Romanians | 97.7 /100 | #93 | Exceptional 62.4% |
| Immigrants | Croatia | 97.6 /100 | #94 | Exceptional 62.3% |
| British | 97.4 /100 | #95 | Exceptional 62.3% |
| Chinese | 97.2 /100 | #96 | Exceptional 62.2% |
| Jordanians | 97.2 /100 | #97 | Exceptional 62.2% |
| Carpatho Rusyns | 97.2 /100 | #98 | Exceptional 62.2% |
| Croatians | 97.1 /100 | #99 | Exceptional 62.2% |
| Icelanders | 96.8 /100 | #100 | Exceptional 62.1% |
| Swedes | 96.8 /100 | #101 | Exceptional 62.1% |
| Luxembourgers | 96.7 /100 | #102 | Exceptional 62.1% |
Demographics Similar to Czechs by College, 1 year or more
In terms of college, 1 year or more, the demographic groups most similar to Czechs are Slavic (60.6%, a difference of 0.070%), Polish (60.7%, a difference of 0.080%), Canadian (60.6%, a difference of 0.080%), Immigrants from Afghanistan (60.7%, a difference of 0.11%), and Iraqi (60.7%, a difference of 0.13%).
| Demographics | Rating | Rank | College, 1 year or more |
| Slovenes | 86.5 /100 | #137 | Excellent 60.9% |
| Taiwanese | 84.3 /100 | #138 | Excellent 60.7% |
| Immigrants | Eritrea | 84.3 /100 | #139 | Excellent 60.7% |
| Iraqis | 83.3 /100 | #140 | Excellent 60.7% |
| Immigrants | Afghanistan | 83.1 /100 | #141 | Excellent 60.7% |
| Poles | 82.8 /100 | #142 | Excellent 60.7% |
| Canadians | 82.7 /100 | #143 | Excellent 60.6% |
| Czechs | 81.9 /100 | #144 | Excellent 60.6% |
| Slavs | 81.1 /100 | #145 | Excellent 60.6% |
| Scottish | 80.2 /100 | #146 | Excellent 60.5% |
| Immigrants | Kenya | 79.1 /100 | #147 | Good 60.5% |
| Kenyans | 79.0 /100 | #148 | Good 60.5% |
| Brazilians | 79.0 /100 | #149 | Good 60.5% |
| Immigrants | Sudan | 77.8 /100 | #150 | Good 60.4% |
| Albanians | 77.8 /100 | #151 | Good 60.4% |