British vs Yup'ik Median Earnings
COMPARE
British
Yup'ik
Median Earnings
Median Earnings Comparison
British
Yup'ik
$48,189
MEDIAN EARNINGS
92.2/ 100
METRIC RATING
132nd/ 347
METRIC RANK
$35,942
MEDIAN EARNINGS
0.0/ 100
METRIC RATING
346th/ 347
METRIC RANK
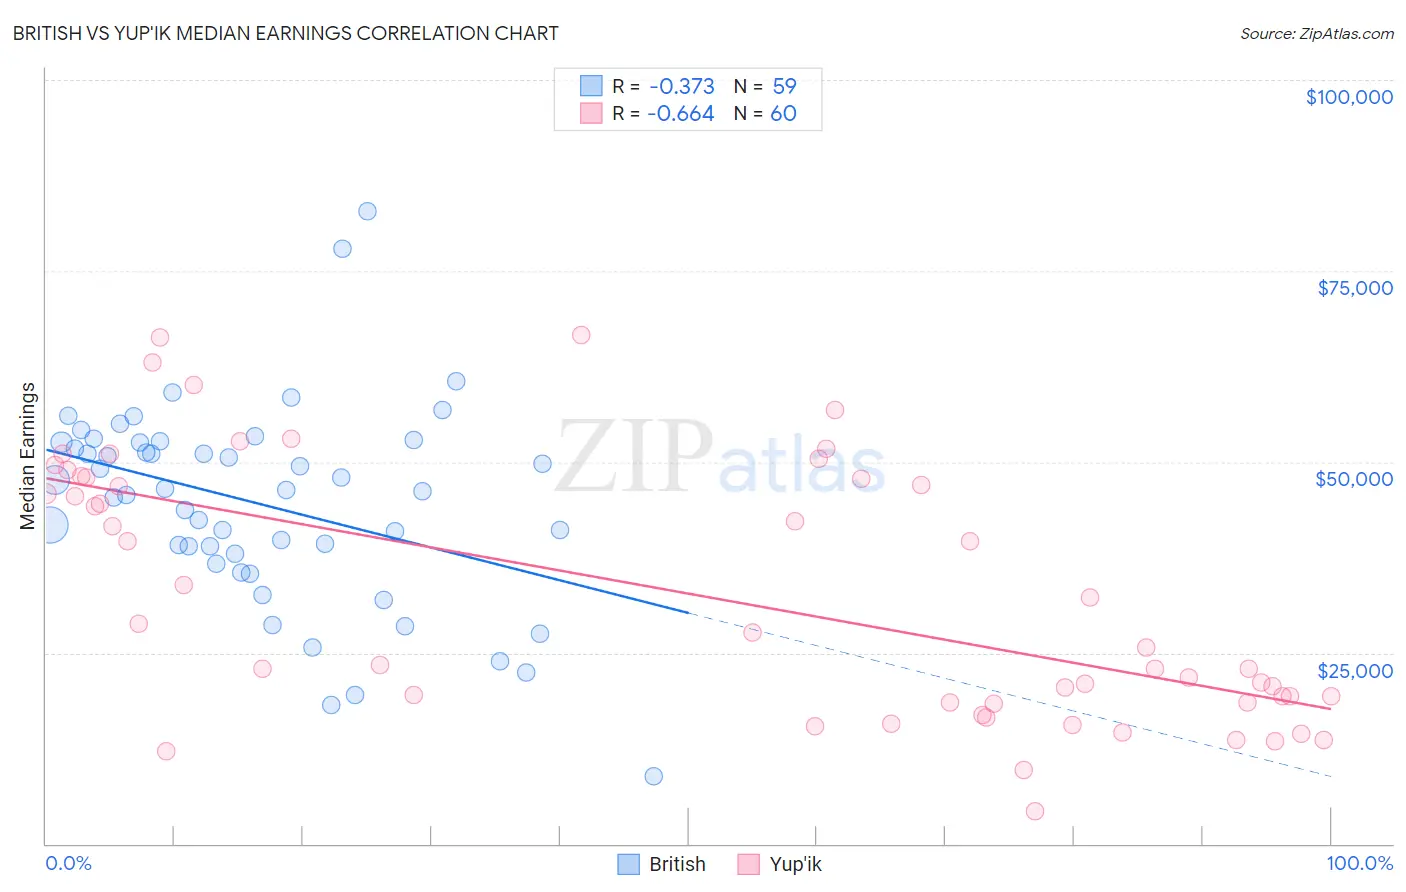
British vs Yup'ik Median Earnings Correlation Chart
The statistical analysis conducted on geographies consisting of 531,344,409 people shows a mild negative correlation between the proportion of British and median earnings in the United States with a correlation coefficient (R) of -0.373 and weighted average of $48,189. Similarly, the statistical analysis conducted on geographies consisting of 39,954,452 people shows a significant negative correlation between the proportion of Yup'ik and median earnings in the United States with a correlation coefficient (R) of -0.664 and weighted average of $35,942, a difference of 34.1%.
Median Earnings Correlation Summary
| Measurement | British | Yup'ik |
| Minimum | $8,915 | $4,192 |
| Maximum | $82,773 | $66,667 |
| Range | $73,858 | $62,475 |
| Mean | $44,491 | $32,584 |
| Median | $46,291 | $26,644 |
| Interquartile 25% (IQ1) | $37,889 | $18,448 |
| Interquartile 75% (IQ3) | $52,582 | $47,862 |
| Interquartile Range (IQR) | $14,693 | $29,414 |
| Standard Deviation (Sample) | $13,191 | $16,777 |
| Standard Deviation (Population) | $13,079 | $16,637 |
Similar Demographics by Median Earnings
Demographics Similar to British by Median Earnings
In terms of median earnings, the demographic groups most similar to British are Zimbabwean ($48,229, a difference of 0.080%), Lebanese ($48,226, a difference of 0.080%), Pakistani ($48,254, a difference of 0.14%), Immigrants from Philippines ($48,266, a difference of 0.16%), and Sierra Leonean ($48,286, a difference of 0.20%).
| Demographics | Rating | Rank | Median Earnings |
| Immigrants | Fiji | 93.3 /100 | #125 | Exceptional $48,305 |
| Assyrians/Chaldeans/Syriacs | 93.3 /100 | #126 | Exceptional $48,304 |
| Sierra Leoneans | 93.1 /100 | #127 | Exceptional $48,286 |
| Immigrants | Philippines | 92.9 /100 | #128 | Exceptional $48,266 |
| Pakistanis | 92.8 /100 | #129 | Exceptional $48,254 |
| Zimbabweans | 92.6 /100 | #130 | Exceptional $48,229 |
| Lebanese | 92.5 /100 | #131 | Exceptional $48,226 |
| British | 92.2 /100 | #132 | Exceptional $48,189 |
| Immigrants | Uganda | 90.5 /100 | #133 | Exceptional $48,041 |
| Sri Lankans | 90.5 /100 | #134 | Exceptional $48,040 |
| Portuguese | 90.4 /100 | #135 | Exceptional $48,032 |
| Slovenes | 90.0 /100 | #136 | Excellent $47,995 |
| Immigrants | Nepal | 89.0 /100 | #137 | Excellent $47,925 |
| Europeans | 88.9 /100 | #138 | Excellent $47,915 |
| Canadians | 88.8 /100 | #139 | Excellent $47,911 |
Demographics Similar to Yup'ik by Median Earnings
In terms of median earnings, the demographic groups most similar to Yup'ik are Puerto Rican ($35,560, a difference of 1.1%), Tohono O'odham ($36,349, a difference of 1.1%), Arapaho ($36,586, a difference of 1.8%), Pueblo ($36,859, a difference of 2.5%), and Hopi ($36,871, a difference of 2.6%).
| Demographics | Rating | Rank | Median Earnings |
| Houma | 0.0 /100 | #333 | Tragic $38,949 |
| Spanish American Indians | 0.0 /100 | #334 | Tragic $38,907 |
| Natives/Alaskans | 0.0 /100 | #335 | Tragic $38,896 |
| Crow | 0.0 /100 | #336 | Tragic $38,707 |
| Immigrants | Cuba | 0.0 /100 | #337 | Tragic $38,426 |
| Pima | 0.0 /100 | #338 | Tragic $38,285 |
| Menominee | 0.0 /100 | #339 | Tragic $37,884 |
| Navajo | 0.0 /100 | #340 | Tragic $36,999 |
| Lumbee | 0.0 /100 | #341 | Tragic $36,876 |
| Hopi | 0.0 /100 | #342 | Tragic $36,871 |
| Pueblo | 0.0 /100 | #343 | Tragic $36,859 |
| Arapaho | 0.0 /100 | #344 | Tragic $36,586 |
| Tohono O'odham | 0.0 /100 | #345 | Tragic $36,349 |
| Yup'ik | 0.0 /100 | #346 | Tragic $35,942 |
| Puerto Ricans | 0.0 /100 | #347 | Tragic $35,560 |