British vs Immigrants from Egypt Median Earnings
COMPARE
British
Immigrants from Egypt
Median Earnings
Median Earnings Comparison
British
Immigrants from Egypt
$48,189
MEDIAN EARNINGS
92.2/ 100
METRIC RATING
132nd/ 347
METRIC RANK
$50,901
MEDIAN EARNINGS
99.8/ 100
METRIC RATING
72nd/ 347
METRIC RANK
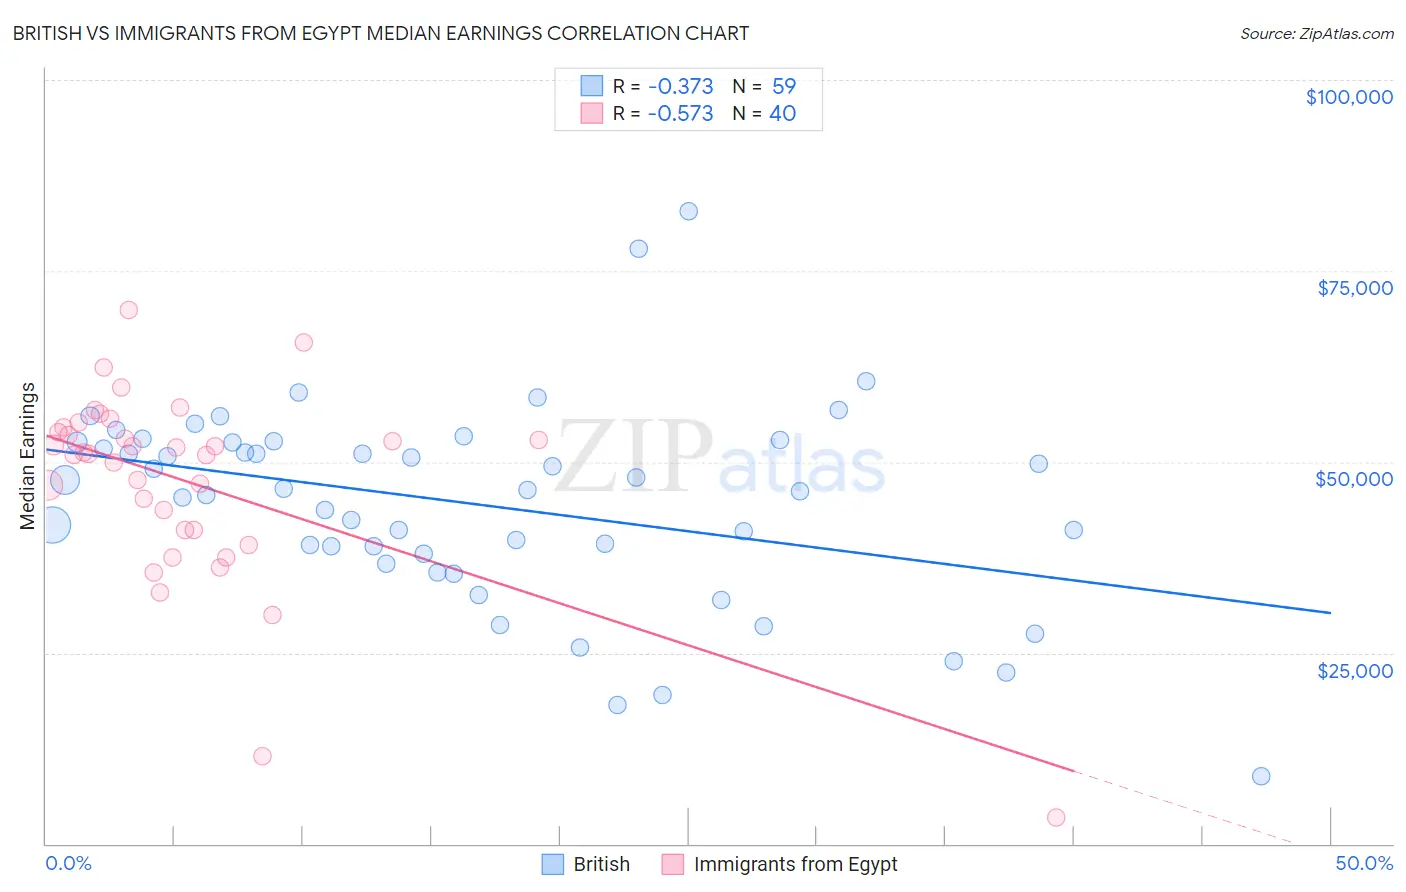
British vs Immigrants from Egypt Median Earnings Correlation Chart
The statistical analysis conducted on geographies consisting of 531,344,409 people shows a mild negative correlation between the proportion of British and median earnings in the United States with a correlation coefficient (R) of -0.373 and weighted average of $48,189. Similarly, the statistical analysis conducted on geographies consisting of 245,492,399 people shows a substantial negative correlation between the proportion of Immigrants from Egypt and median earnings in the United States with a correlation coefficient (R) of -0.573 and weighted average of $50,901, a difference of 5.6%.
Median Earnings Correlation Summary
| Measurement | British | Immigrants from Egypt |
| Minimum | $8,915 | $3,500 |
| Maximum | $82,773 | $69,809 |
| Range | $73,858 | $66,309 |
| Mean | $44,491 | $47,452 |
| Median | $46,291 | $51,173 |
| Interquartile 25% (IQ1) | $37,889 | $41,070 |
| Interquartile 75% (IQ3) | $52,582 | $54,227 |
| Interquartile Range (IQR) | $14,693 | $13,157 |
| Standard Deviation (Sample) | $13,191 | $12,746 |
| Standard Deviation (Population) | $13,079 | $12,585 |
Similar Demographics by Median Earnings
Demographics Similar to British by Median Earnings
In terms of median earnings, the demographic groups most similar to British are Zimbabwean ($48,229, a difference of 0.080%), Lebanese ($48,226, a difference of 0.080%), Pakistani ($48,254, a difference of 0.14%), Immigrants from Philippines ($48,266, a difference of 0.16%), and Sierra Leonean ($48,286, a difference of 0.20%).
| Demographics | Rating | Rank | Median Earnings |
| Immigrants | Fiji | 93.3 /100 | #125 | Exceptional $48,305 |
| Assyrians/Chaldeans/Syriacs | 93.3 /100 | #126 | Exceptional $48,304 |
| Sierra Leoneans | 93.1 /100 | #127 | Exceptional $48,286 |
| Immigrants | Philippines | 92.9 /100 | #128 | Exceptional $48,266 |
| Pakistanis | 92.8 /100 | #129 | Exceptional $48,254 |
| Zimbabweans | 92.6 /100 | #130 | Exceptional $48,229 |
| Lebanese | 92.5 /100 | #131 | Exceptional $48,226 |
| British | 92.2 /100 | #132 | Exceptional $48,189 |
| Immigrants | Uganda | 90.5 /100 | #133 | Exceptional $48,041 |
| Sri Lankans | 90.5 /100 | #134 | Exceptional $48,040 |
| Portuguese | 90.4 /100 | #135 | Exceptional $48,032 |
| Slovenes | 90.0 /100 | #136 | Excellent $47,995 |
| Immigrants | Nepal | 89.0 /100 | #137 | Excellent $47,925 |
| Europeans | 88.9 /100 | #138 | Excellent $47,915 |
| Canadians | 88.8 /100 | #139 | Excellent $47,911 |
Demographics Similar to Immigrants from Egypt by Median Earnings
In terms of median earnings, the demographic groups most similar to Immigrants from Egypt are Immigrants from Ukraine ($50,984, a difference of 0.16%), Immigrants from Netherlands ($50,818, a difference of 0.16%), Lithuanian ($50,991, a difference of 0.18%), Mongolian ($51,038, a difference of 0.27%), and South African ($50,752, a difference of 0.29%).
| Demographics | Rating | Rank | Median Earnings |
| Greeks | 99.9 /100 | #65 | Exceptional $51,164 |
| Afghans | 99.9 /100 | #66 | Exceptional $51,112 |
| Immigrants | Spain | 99.9 /100 | #67 | Exceptional $51,092 |
| Paraguayans | 99.9 /100 | #68 | Exceptional $51,068 |
| Mongolians | 99.8 /100 | #69 | Exceptional $51,038 |
| Lithuanians | 99.8 /100 | #70 | Exceptional $50,991 |
| Immigrants | Ukraine | 99.8 /100 | #71 | Exceptional $50,984 |
| Immigrants | Egypt | 99.8 /100 | #72 | Exceptional $50,901 |
| Immigrants | Netherlands | 99.8 /100 | #73 | Exceptional $50,818 |
| South Africans | 99.8 /100 | #74 | Exceptional $50,752 |
| Immigrants | Scotland | 99.8 /100 | #75 | Exceptional $50,741 |
| Immigrants | Italy | 99.7 /100 | #76 | Exceptional $50,581 |
| Immigrants | Western Europe | 99.7 /100 | #77 | Exceptional $50,549 |
| Argentineans | 99.6 /100 | #78 | Exceptional $50,399 |
| Laotians | 99.6 /100 | #79 | Exceptional $50,343 |