British vs Seminole Median Earnings
COMPARE
British
Seminole
Median Earnings
Median Earnings Comparison
British
Seminole
$48,189
MEDIAN EARNINGS
92.2/ 100
METRIC RATING
132nd/ 347
METRIC RANK
$40,233
MEDIAN EARNINGS
0.0/ 100
METRIC RATING
315th/ 347
METRIC RANK
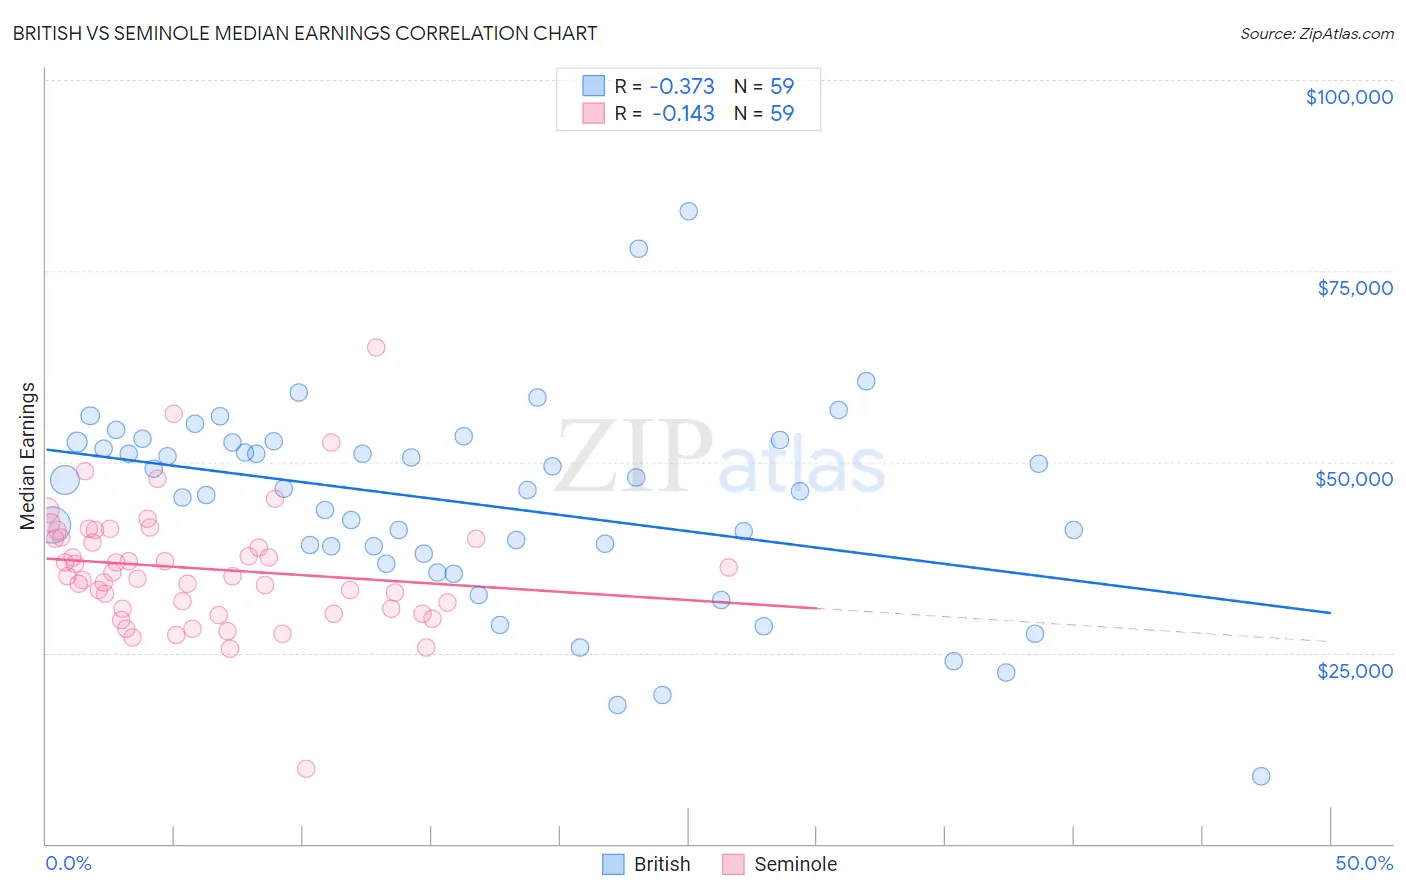
British vs Seminole Median Earnings Correlation Chart
The statistical analysis conducted on geographies consisting of 531,344,409 people shows a mild negative correlation between the proportion of British and median earnings in the United States with a correlation coefficient (R) of -0.373 and weighted average of $48,189. Similarly, the statistical analysis conducted on geographies consisting of 118,310,048 people shows a poor negative correlation between the proportion of Seminole and median earnings in the United States with a correlation coefficient (R) of -0.143 and weighted average of $40,233, a difference of 19.8%.
Median Earnings Correlation Summary
| Measurement | British | Seminole |
| Minimum | $8,915 | $9,817 |
| Maximum | $82,773 | $65,023 |
| Range | $73,858 | $55,206 |
| Mean | $44,491 | $36,018 |
| Median | $46,291 | $35,101 |
| Interquartile 25% (IQ1) | $37,889 | $30,747 |
| Interquartile 75% (IQ3) | $52,582 | $40,152 |
| Interquartile Range (IQR) | $14,693 | $9,405 |
| Standard Deviation (Sample) | $13,191 | $8,228 |
| Standard Deviation (Population) | $13,079 | $8,158 |
Similar Demographics by Median Earnings
Demographics Similar to British by Median Earnings
In terms of median earnings, the demographic groups most similar to British are Zimbabwean ($48,229, a difference of 0.080%), Lebanese ($48,226, a difference of 0.080%), Pakistani ($48,254, a difference of 0.14%), Immigrants from Philippines ($48,266, a difference of 0.16%), and Sierra Leonean ($48,286, a difference of 0.20%).
| Demographics | Rating | Rank | Median Earnings |
| Immigrants | Fiji | 93.3 /100 | #125 | Exceptional $48,305 |
| Assyrians/Chaldeans/Syriacs | 93.3 /100 | #126 | Exceptional $48,304 |
| Sierra Leoneans | 93.1 /100 | #127 | Exceptional $48,286 |
| Immigrants | Philippines | 92.9 /100 | #128 | Exceptional $48,266 |
| Pakistanis | 92.8 /100 | #129 | Exceptional $48,254 |
| Zimbabweans | 92.6 /100 | #130 | Exceptional $48,229 |
| Lebanese | 92.5 /100 | #131 | Exceptional $48,226 |
| British | 92.2 /100 | #132 | Exceptional $48,189 |
| Immigrants | Uganda | 90.5 /100 | #133 | Exceptional $48,041 |
| Sri Lankans | 90.5 /100 | #134 | Exceptional $48,040 |
| Portuguese | 90.4 /100 | #135 | Exceptional $48,032 |
| Slovenes | 90.0 /100 | #136 | Excellent $47,995 |
| Immigrants | Nepal | 89.0 /100 | #137 | Excellent $47,925 |
| Europeans | 88.9 /100 | #138 | Excellent $47,915 |
| Canadians | 88.8 /100 | #139 | Excellent $47,911 |
Demographics Similar to Seminole by Median Earnings
In terms of median earnings, the demographic groups most similar to Seminole are Cheyenne ($40,233, a difference of 0.0%), Choctaw ($40,270, a difference of 0.090%), Immigrants from Honduras ($40,195, a difference of 0.090%), Fijian ($40,193, a difference of 0.10%), and Chippewa ($40,287, a difference of 0.13%).
| Demographics | Rating | Rank | Median Earnings |
| Cubans | 0.0 /100 | #308 | Tragic $40,619 |
| Immigrants | Haiti | 0.0 /100 | #309 | Tragic $40,550 |
| Apache | 0.0 /100 | #310 | Tragic $40,388 |
| Hispanics or Latinos | 0.0 /100 | #311 | Tragic $40,288 |
| Chippewa | 0.0 /100 | #312 | Tragic $40,287 |
| Choctaw | 0.0 /100 | #313 | Tragic $40,270 |
| Cheyenne | 0.0 /100 | #314 | Tragic $40,233 |
| Seminole | 0.0 /100 | #315 | Tragic $40,233 |
| Immigrants | Honduras | 0.0 /100 | #316 | Tragic $40,195 |
| Fijians | 0.0 /100 | #317 | Tragic $40,193 |
| Dutch West Indians | 0.0 /100 | #318 | Tragic $40,107 |
| Blacks/African Americans | 0.0 /100 | #319 | Tragic $40,085 |
| Immigrants | Bahamas | 0.0 /100 | #320 | Tragic $39,861 |
| Mexicans | 0.0 /100 | #321 | Tragic $39,834 |
| Immigrants | Central America | 0.0 /100 | #322 | Tragic $39,762 |