Brazilian vs Aleut Single Male Poverty
COMPARE
Brazilian
Aleut
Single Male Poverty
Single Male Poverty Comparison
Brazilians
Aleuts
11.8%
SINGLE MALE POVERTY
99.8/ 100
METRIC RATING
59th/ 347
METRIC RANK
15.4%
SINGLE MALE POVERTY
0.0/ 100
METRIC RATING
303rd/ 347
METRIC RANK
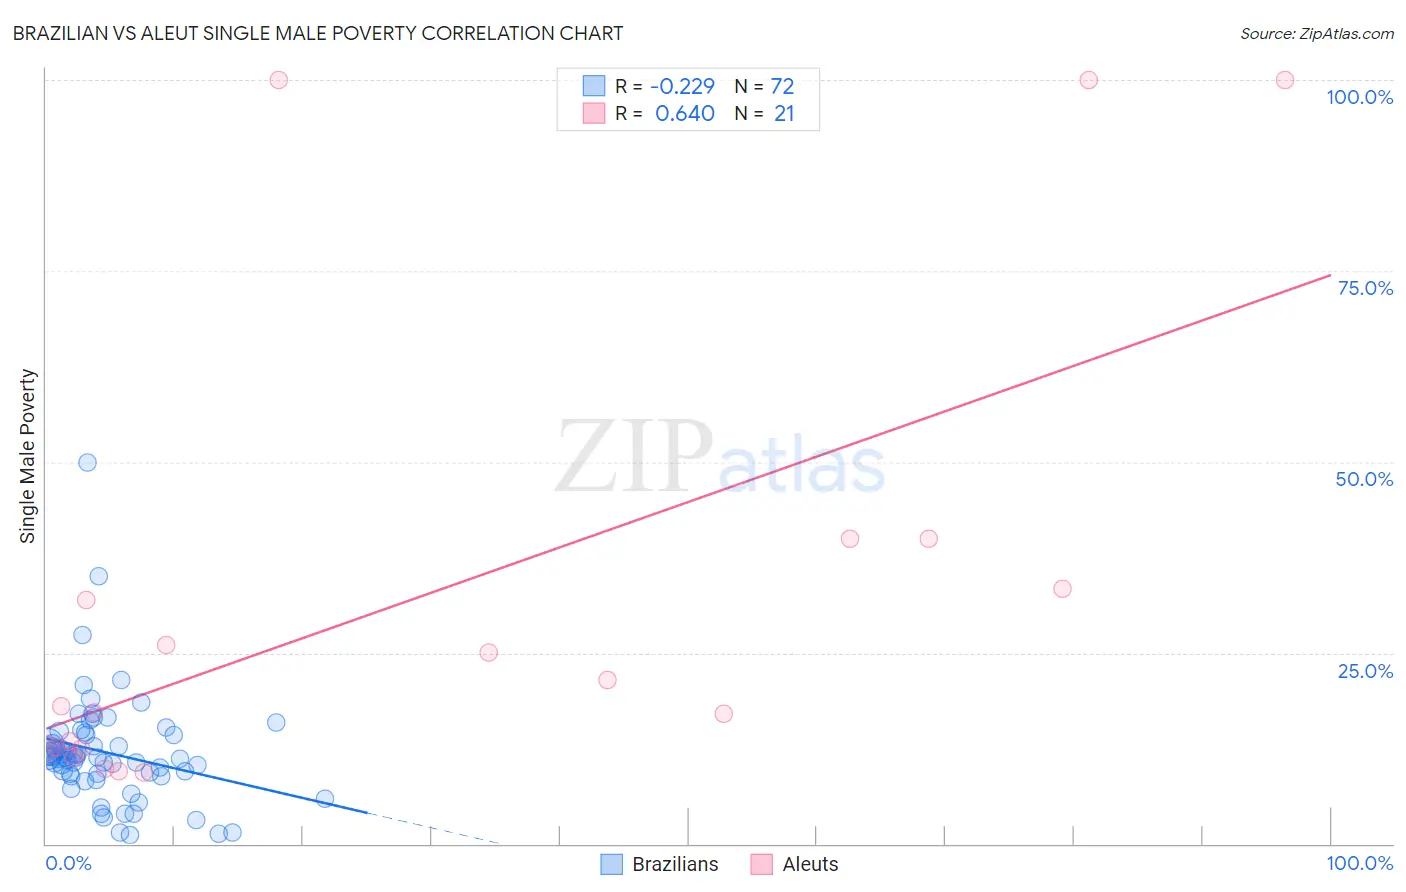
Brazilian vs Aleut Single Male Poverty Correlation Chart
The statistical analysis conducted on geographies consisting of 290,096,806 people shows a weak negative correlation between the proportion of Brazilians and poverty level among single males in the United States with a correlation coefficient (R) of -0.229 and weighted average of 11.8%. Similarly, the statistical analysis conducted on geographies consisting of 59,537,447 people shows a significant positive correlation between the proportion of Aleuts and poverty level among single males in the United States with a correlation coefficient (R) of 0.640 and weighted average of 15.4%, a difference of 31.0%.
Single Male Poverty Correlation Summary
| Measurement | Brazilian | Aleut |
| Minimum | 1.1% | 9.3% |
| Maximum | 50.0% | 100.0% |
| Range | 48.9% | 90.7% |
| Mean | 11.9% | 31.5% |
| Median | 11.3% | 18.0% |
| Interquartile 25% (IQ1) | 9.0% | 12.5% |
| Interquartile 75% (IQ3) | 14.3% | 36.7% |
| Interquartile Range (IQR) | 5.3% | 24.2% |
| Standard Deviation (Sample) | 7.3% | 30.2% |
| Standard Deviation (Population) | 7.2% | 29.5% |
Similar Demographics by Single Male Poverty
Demographics Similar to Brazilians by Single Male Poverty
In terms of single male poverty, the demographic groups most similar to Brazilians are Immigrants from Brazil (11.7%, a difference of 0.080%), Immigrants from Romania (11.7%, a difference of 0.11%), Peruvian (11.8%, a difference of 0.21%), Cambodian (11.8%, a difference of 0.23%), and Burmese (11.7%, a difference of 0.26%).
| Demographics | Rating | Rank | Single Male Poverty |
| Samoans | 99.9 /100 | #52 | Exceptional 11.7% |
| Bulgarians | 99.9 /100 | #53 | Exceptional 11.7% |
| Immigrants | Uzbekistan | 99.9 /100 | #54 | Exceptional 11.7% |
| Cypriots | 99.9 /100 | #55 | Exceptional 11.7% |
| Burmese | 99.8 /100 | #56 | Exceptional 11.7% |
| Immigrants | Romania | 99.8 /100 | #57 | Exceptional 11.7% |
| Immigrants | Brazil | 99.8 /100 | #58 | Exceptional 11.7% |
| Brazilians | 99.8 /100 | #59 | Exceptional 11.8% |
| Peruvians | 99.8 /100 | #60 | Exceptional 11.8% |
| Cambodians | 99.8 /100 | #61 | Exceptional 11.8% |
| Immigrants | Sri Lanka | 99.7 /100 | #62 | Exceptional 11.8% |
| Immigrants | Belarus | 99.7 /100 | #63 | Exceptional 11.8% |
| Immigrants | Eastern Europe | 99.6 /100 | #64 | Exceptional 11.8% |
| Laotians | 99.6 /100 | #65 | Exceptional 11.9% |
| Immigrants | Uruguay | 99.6 /100 | #66 | Exceptional 11.9% |
Demographics Similar to Aleuts by Single Male Poverty
In terms of single male poverty, the demographic groups most similar to Aleuts are Alaska Native (15.4%, a difference of 0.11%), Blackfeet (15.5%, a difference of 0.64%), Alsatian (15.2%, a difference of 1.0%), Pennsylvania German (15.6%, a difference of 1.1%), and Dominican (15.2%, a difference of 1.2%).
| Demographics | Rating | Rank | Single Male Poverty |
| Africans | 0.0 /100 | #296 | Tragic 14.7% |
| Immigrants | Dominican Republic | 0.0 /100 | #297 | Tragic 14.8% |
| French American Indians | 0.0 /100 | #298 | Tragic 15.0% |
| Delaware | 0.0 /100 | #299 | Tragic 15.0% |
| Cree | 0.0 /100 | #300 | Tragic 15.1% |
| Dominicans | 0.0 /100 | #301 | Tragic 15.2% |
| Alsatians | 0.0 /100 | #302 | Tragic 15.2% |
| Aleuts | 0.0 /100 | #303 | Tragic 15.4% |
| Alaska Natives | 0.0 /100 | #304 | Tragic 15.4% |
| Blackfeet | 0.0 /100 | #305 | Tragic 15.5% |
| Pennsylvania Germans | 0.0 /100 | #306 | Tragic 15.6% |
| Ute | 0.0 /100 | #307 | Tragic 15.7% |
| Potawatomi | 0.0 /100 | #308 | Tragic 15.8% |
| Americans | 0.0 /100 | #309 | Tragic 15.8% |
| Yakama | 0.0 /100 | #310 | Tragic 15.9% |