Brazilian vs Aleut No Schooling Completed
COMPARE
Brazilian
Aleut
No Schooling Completed
No Schooling Completed Comparison
Brazilians
Aleuts
2.1%
NO SCHOOLING COMPLETED
60.2/ 100
METRIC RATING
165th/ 347
METRIC RANK
1.6%
NO SCHOOLING COMPLETED
99.9/ 100
METRIC RATING
36th/ 347
METRIC RANK
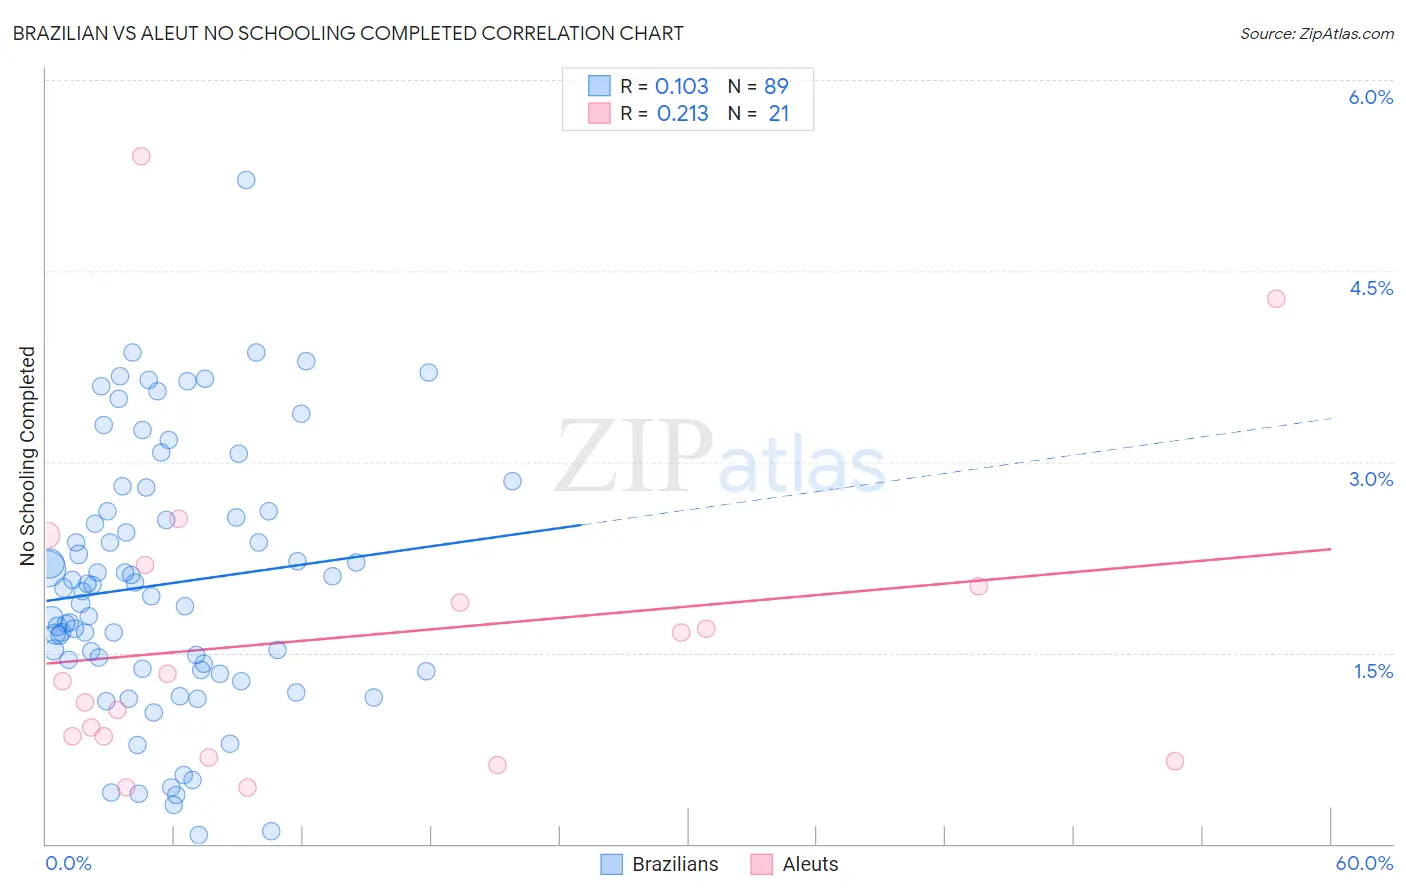
Brazilian vs Aleut No Schooling Completed Correlation Chart
The statistical analysis conducted on geographies consisting of 321,239,467 people shows a poor positive correlation between the proportion of Brazilians and percentage of population with no schooling in the United States with a correlation coefficient (R) of 0.103 and weighted average of 2.1%. Similarly, the statistical analysis conducted on geographies consisting of 61,492,558 people shows a weak positive correlation between the proportion of Aleuts and percentage of population with no schooling in the United States with a correlation coefficient (R) of 0.213 and weighted average of 1.6%, a difference of 31.1%.
No Schooling Completed Correlation Summary
| Measurement | Brazilian | Aleut |
| Minimum | 0.065% | 0.44% |
| Maximum | 5.2% | 5.4% |
| Range | 5.1% | 5.0% |
| Mean | 2.0% | 1.6% |
| Median | 2.0% | 1.3% |
| Interquartile 25% (IQ1) | 1.4% | 0.76% |
| Interquartile 75% (IQ3) | 2.6% | 2.1% |
| Interquartile Range (IQR) | 1.2% | 1.3% |
| Standard Deviation (Sample) | 1.0% | 1.3% |
| Standard Deviation (Population) | 1.0% | 1.2% |
Similar Demographics by No Schooling Completed
Demographics Similar to Brazilians by No Schooling Completed
In terms of no schooling completed, the demographic groups most similar to Brazilians are Dutch West Indian (2.1%, a difference of 0.050%), Comanche (2.1%, a difference of 0.060%), Egyptian (2.1%, a difference of 0.15%), Cheyenne (2.1%, a difference of 0.23%), and Albanian (2.1%, a difference of 0.28%).
| Demographics | Rating | Rank | No Schooling Completed |
| Immigrants | Korea | 66.7 /100 | #158 | Good 2.0% |
| Immigrants | Spain | 66.4 /100 | #159 | Good 2.0% |
| Kenyans | 65.7 /100 | #160 | Good 2.0% |
| Ugandans | 64.6 /100 | #161 | Good 2.0% |
| Immigrants | Brazil | 63.8 /100 | #162 | Good 2.1% |
| Albanians | 62.2 /100 | #163 | Good 2.1% |
| Comanche | 60.7 /100 | #164 | Good 2.1% |
| Brazilians | 60.2 /100 | #165 | Good 2.1% |
| Dutch West Indians | 59.9 /100 | #166 | Average 2.1% |
| Egyptians | 59.2 /100 | #167 | Average 2.1% |
| Cheyenne | 58.6 /100 | #168 | Average 2.1% |
| Apache | 56.7 /100 | #169 | Average 2.1% |
| Argentineans | 56.0 /100 | #170 | Average 2.1% |
| Immigrants | Poland | 55.2 /100 | #171 | Average 2.1% |
| Immigrants | Argentina | 52.7 /100 | #172 | Average 2.1% |
Demographics Similar to Aleuts by No Schooling Completed
In terms of no schooling completed, the demographic groups most similar to Aleuts are Belgian (1.6%, a difference of 0.27%), Northern European (1.6%, a difference of 0.40%), Native Hawaiian (1.6%, a difference of 0.67%), Eastern European (1.6%, a difference of 1.0%), and Luxembourger (1.6%, a difference of 1.0%).
| Demographics | Rating | Rank | No Schooling Completed |
| Lumbee | 100.0 /100 | #29 | Exceptional 1.5% |
| British | 100.0 /100 | #30 | Exceptional 1.5% |
| Inupiat | 100.0 /100 | #31 | Exceptional 1.5% |
| Swiss | 100.0 /100 | #32 | Exceptional 1.5% |
| Italians | 100.0 /100 | #33 | Exceptional 1.5% |
| Latvians | 100.0 /100 | #34 | Exceptional 1.5% |
| Eastern Europeans | 100.0 /100 | #35 | Exceptional 1.6% |
| Aleuts | 99.9 /100 | #36 | Exceptional 1.6% |
| Belgians | 99.9 /100 | #37 | Exceptional 1.6% |
| Northern Europeans | 99.9 /100 | #38 | Exceptional 1.6% |
| Native Hawaiians | 99.9 /100 | #39 | Exceptional 1.6% |
| Luxembourgers | 99.9 /100 | #40 | Exceptional 1.6% |
| Hungarians | 99.9 /100 | #41 | Exceptional 1.6% |
| Bulgarians | 99.9 /100 | #42 | Exceptional 1.6% |
| Australians | 99.9 /100 | #43 | Exceptional 1.6% |