Chinese vs Immigrants from Saudi Arabia Householder Income Under 25 years
COMPARE
Chinese
Immigrants from Saudi Arabia
Householder Income Under 25 years
Householder Income Under 25 years Comparison
Chinese
Immigrants from Saudi Arabia
$58,162
HOUSEHOLDER INCOME UNDER 25 YEARS
100.0/ 100
METRIC RATING
9th/ 347
METRIC RANK
$46,187
HOUSEHOLDER INCOME UNDER 25 YEARS
0.0/ 100
METRIC RATING
323rd/ 347
METRIC RANK
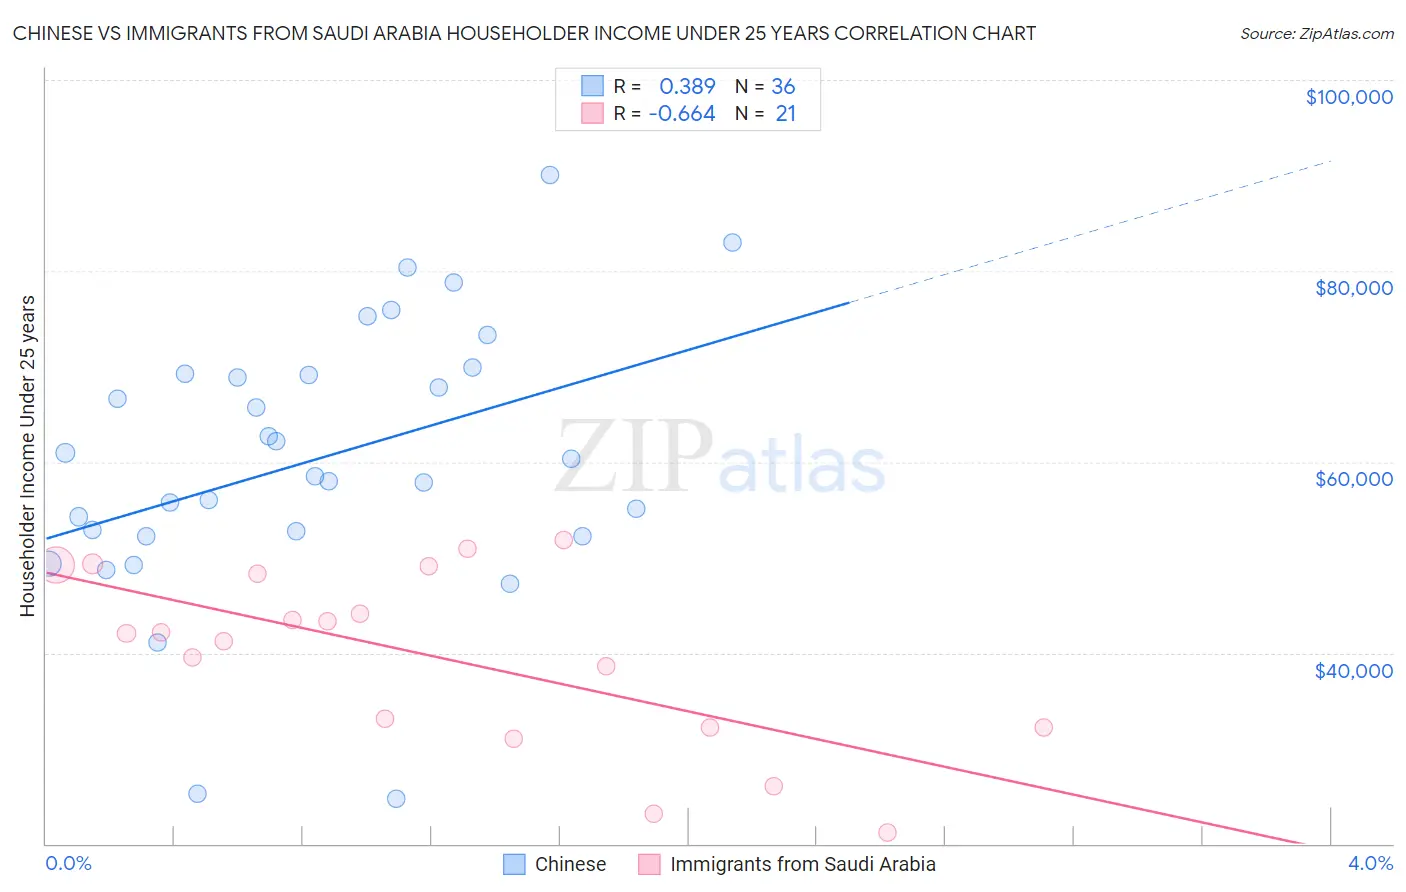
Chinese vs Immigrants from Saudi Arabia Householder Income Under 25 years Correlation Chart
The statistical analysis conducted on geographies consisting of 61,331,136 people shows a mild positive correlation between the proportion of Chinese and household income with householder under the age of 25 in the United States with a correlation coefficient (R) of 0.389 and weighted average of $58,162. Similarly, the statistical analysis conducted on geographies consisting of 152,509,981 people shows a significant negative correlation between the proportion of Immigrants from Saudi Arabia and household income with householder under the age of 25 in the United States with a correlation coefficient (R) of -0.664 and weighted average of $46,187, a difference of 25.9%.
Householder Income Under 25 years Correlation Summary
| Measurement | Chinese | Immigrants from Saudi Arabia |
| Minimum | $24,709 | $21,200 |
| Maximum | $90,052 | $51,786 |
| Range | $65,343 | $30,586 |
| Mean | $60,302 | $39,611 |
| Median | $59,375 | $42,009 |
| Interquartile 25% (IQ1) | $52,464 | $32,174 |
| Interquartile 75% (IQ3) | $69,171 | $48,671 |
| Interquartile Range (IQR) | $16,707 | $16,497 |
| Standard Deviation (Sample) | $14,147 | $9,248 |
| Standard Deviation (Population) | $13,949 | $9,026 |
Similar Demographics by Householder Income Under 25 years
Demographics Similar to Chinese by Householder Income Under 25 years
In terms of householder income under 25 years, the demographic groups most similar to Chinese are Indian (Asian) ($58,239, a difference of 0.13%), Afghan ($58,019, a difference of 0.25%), Immigrants from China ($57,931, a difference of 0.40%), Immigrants from Philippines ($57,930, a difference of 0.40%), and Bolivian ($58,506, a difference of 0.59%).
| Demographics | Rating | Rank | Householder Income Under 25 years |
| Immigrants | Hong Kong | 100.0 /100 | #2 | Exceptional $62,083 |
| Immigrants | India | 100.0 /100 | #3 | Exceptional $59,914 |
| Immigrants | Taiwan | 100.0 /100 | #4 | Exceptional $59,424 |
| Immigrants | Bolivia | 100.0 /100 | #5 | Exceptional $59,389 |
| Thais | 100.0 /100 | #6 | Exceptional $59,187 |
| Bolivians | 100.0 /100 | #7 | Exceptional $58,506 |
| Indians (Asian) | 100.0 /100 | #8 | Exceptional $58,239 |
| Chinese | 100.0 /100 | #9 | Exceptional $58,162 |
| Afghans | 100.0 /100 | #10 | Exceptional $58,019 |
| Immigrants | China | 100.0 /100 | #11 | Exceptional $57,931 |
| Immigrants | Philippines | 100.0 /100 | #12 | Exceptional $57,930 |
| Immigrants | South Central Asia | 100.0 /100 | #13 | Exceptional $57,818 |
| Filipinos | 100.0 /100 | #14 | Exceptional $57,740 |
| Koreans | 100.0 /100 | #15 | Exceptional $57,730 |
| Immigrants | Afghanistan | 100.0 /100 | #16 | Exceptional $57,478 |
Demographics Similar to Immigrants from Saudi Arabia by Householder Income Under 25 years
In terms of householder income under 25 years, the demographic groups most similar to Immigrants from Saudi Arabia are Sioux ($46,417, a difference of 0.50%), Potawatomi ($46,462, a difference of 0.60%), Dutch West Indian ($45,816, a difference of 0.81%), Immigrants from Bahamas ($45,793, a difference of 0.86%), and Osage ($45,764, a difference of 0.92%).
| Demographics | Rating | Rank | Householder Income Under 25 years |
| Sudanese | 0.0 /100 | #316 | Tragic $46,982 |
| Hopi | 0.0 /100 | #317 | Tragic $46,978 |
| Spanish Americans | 0.0 /100 | #318 | Tragic $46,913 |
| Africans | 0.0 /100 | #319 | Tragic $46,838 |
| Immigrants | Sudan | 0.0 /100 | #320 | Tragic $46,791 |
| Potawatomi | 0.0 /100 | #321 | Tragic $46,462 |
| Sioux | 0.0 /100 | #322 | Tragic $46,417 |
| Immigrants | Saudi Arabia | 0.0 /100 | #323 | Tragic $46,187 |
| Dutch West Indians | 0.0 /100 | #324 | Tragic $45,816 |
| Immigrants | Bahamas | 0.0 /100 | #325 | Tragic $45,793 |
| Osage | 0.0 /100 | #326 | Tragic $45,764 |
| Bahamians | 0.0 /100 | #327 | Tragic $45,743 |
| German Russians | 0.0 /100 | #328 | Tragic $45,673 |
| Seminole | 0.0 /100 | #329 | Tragic $45,649 |
| Indonesians | 0.0 /100 | #330 | Tragic $45,566 |