Immigrants from Bolivia vs Immigrants from Haiti Per Capita Income
COMPARE
Immigrants from Bolivia
Immigrants from Haiti
Per Capita Income
Per Capita Income Comparison
Immigrants from Bolivia
Immigrants from Haiti
$48,970
PER CAPITA INCOME
99.7/ 100
METRIC RATING
75th/ 347
METRIC RANK
$36,849
PER CAPITA INCOME
0.0/ 100
METRIC RATING
306th/ 347
METRIC RANK
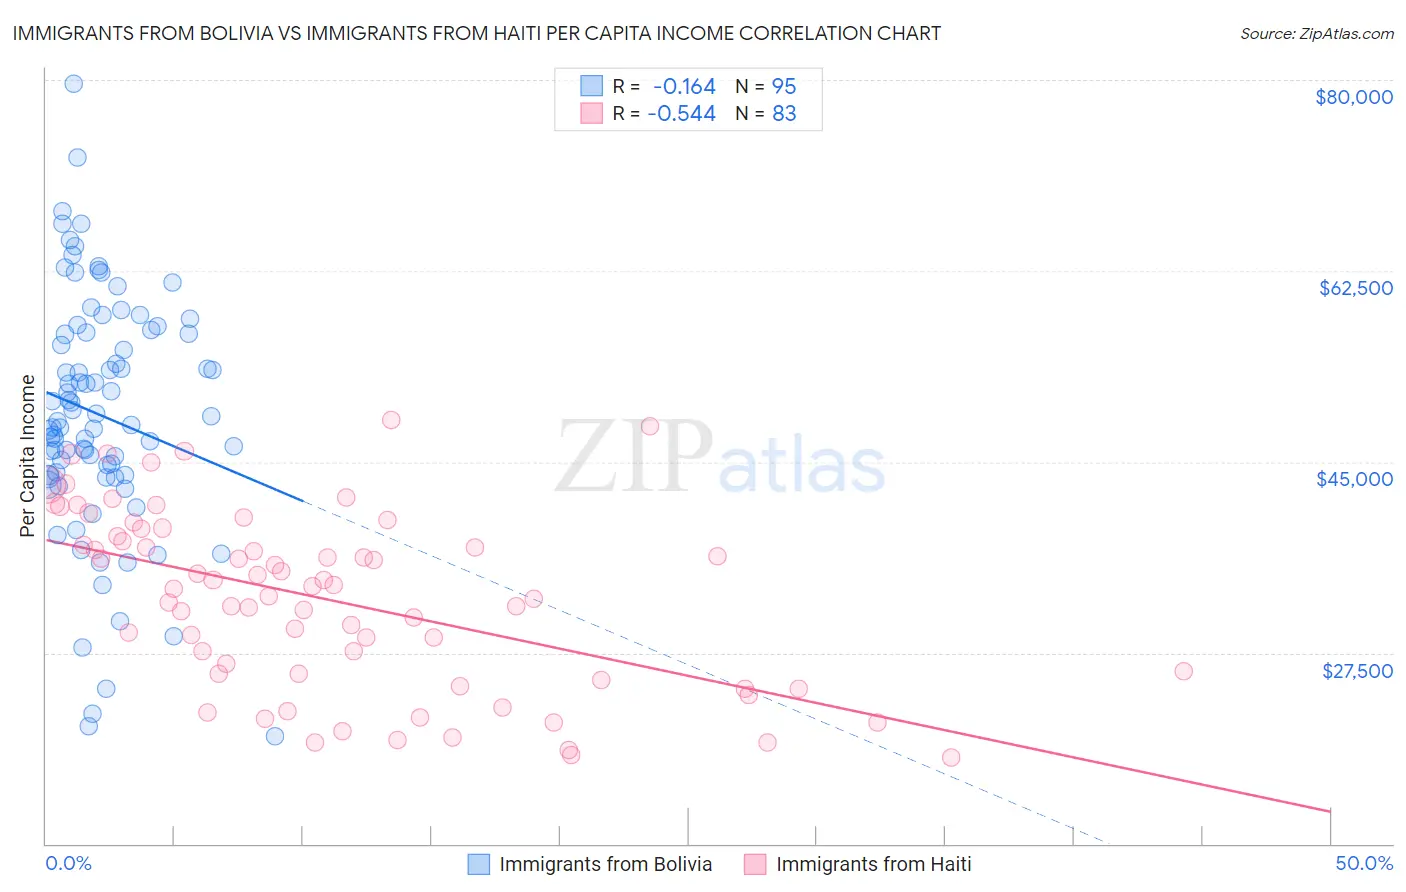
Immigrants from Bolivia vs Immigrants from Haiti Per Capita Income Correlation Chart
The statistical analysis conducted on geographies consisting of 158,726,155 people shows a poor negative correlation between the proportion of Immigrants from Bolivia and per capita income in the United States with a correlation coefficient (R) of -0.164 and weighted average of $48,970. Similarly, the statistical analysis conducted on geographies consisting of 225,290,875 people shows a substantial negative correlation between the proportion of Immigrants from Haiti and per capita income in the United States with a correlation coefficient (R) of -0.544 and weighted average of $36,849, a difference of 32.9%.
Per Capita Income Correlation Summary
| Measurement | Immigrants from Bolivia | Immigrants from Haiti |
| Minimum | $19,857 | $17,858 |
| Maximum | $79,655 | $48,799 |
| Range | $59,798 | $30,941 |
| Mean | $49,279 | $32,340 |
| Median | $48,688 | $33,392 |
| Interquartile 25% (IQ1) | $43,768 | $25,569 |
| Interquartile 75% (IQ3) | $56,811 | $38,157 |
| Interquartile Range (IQR) | $13,042 | $12,588 |
| Standard Deviation (Sample) | $11,114 | $8,072 |
| Standard Deviation (Population) | $11,056 | $8,023 |
Similar Demographics by Per Capita Income
Demographics Similar to Immigrants from Bolivia by Per Capita Income
In terms of per capita income, the demographic groups most similar to Immigrants from Bolivia are Immigrants from England ($48,844, a difference of 0.26%), Mongolian ($49,173, a difference of 0.41%), Immigrants from Kazakhstan ($48,747, a difference of 0.46%), Immigrants from Italy ($48,654, a difference of 0.65%), and Immigrants from Hungary ($49,303, a difference of 0.68%).
| Demographics | Rating | Rank | Per Capita Income |
| Lithuanians | 99.8 /100 | #68 | Exceptional $49,448 |
| Immigrants | Canada | 99.8 /100 | #69 | Exceptional $49,412 |
| Immigrants | Eastern Europe | 99.8 /100 | #70 | Exceptional $49,316 |
| Greeks | 99.8 /100 | #71 | Exceptional $49,309 |
| Immigrants | Hungary | 99.8 /100 | #72 | Exceptional $49,303 |
| Immigrants | North America | 99.8 /100 | #73 | Exceptional $49,302 |
| Mongolians | 99.8 /100 | #74 | Exceptional $49,173 |
| Immigrants | Bolivia | 99.7 /100 | #75 | Exceptional $48,970 |
| Immigrants | England | 99.7 /100 | #76 | Exceptional $48,844 |
| Immigrants | Kazakhstan | 99.7 /100 | #77 | Exceptional $48,747 |
| Immigrants | Italy | 99.6 /100 | #78 | Exceptional $48,654 |
| Romanians | 99.5 /100 | #79 | Exceptional $48,445 |
| Egyptians | 99.5 /100 | #80 | Exceptional $48,358 |
| Armenians | 99.4 /100 | #81 | Exceptional $48,287 |
| Immigrants | Indonesia | 99.4 /100 | #82 | Exceptional $48,195 |
Demographics Similar to Immigrants from Haiti by Per Capita Income
In terms of per capita income, the demographic groups most similar to Immigrants from Haiti are Immigrants from Latin America ($36,823, a difference of 0.070%), Inupiat ($36,999, a difference of 0.41%), Fijian ($36,690, a difference of 0.43%), Honduran ($37,031, a difference of 0.49%), and Immigrants from Honduras ($36,665, a difference of 0.50%).
| Demographics | Rating | Rank | Per Capita Income |
| Cherokee | 0.1 /100 | #299 | Tragic $37,203 |
| Immigrants | Bahamas | 0.1 /100 | #300 | Tragic $37,193 |
| Ottawa | 0.1 /100 | #301 | Tragic $37,101 |
| Shoshone | 0.1 /100 | #302 | Tragic $37,072 |
| Paiute | 0.1 /100 | #303 | Tragic $37,066 |
| Hondurans | 0.1 /100 | #304 | Tragic $37,031 |
| Inupiat | 0.1 /100 | #305 | Tragic $36,999 |
| Immigrants | Haiti | 0.0 /100 | #306 | Tragic $36,849 |
| Immigrants | Latin America | 0.0 /100 | #307 | Tragic $36,823 |
| Fijians | 0.0 /100 | #308 | Tragic $36,690 |
| Immigrants | Honduras | 0.0 /100 | #309 | Tragic $36,665 |
| Ute | 0.0 /100 | #310 | Tragic $36,651 |
| Chippewa | 0.0 /100 | #311 | Tragic $36,631 |
| Chickasaw | 0.0 /100 | #312 | Tragic $36,475 |
| Bahamians | 0.0 /100 | #313 | Tragic $36,427 |