Kiowa vs Immigrants from Haiti Per Capita Income
COMPARE
Kiowa
Immigrants from Haiti
Per Capita Income
Per Capita Income Comparison
Kiowa
Immigrants from Haiti
$35,102
PER CAPITA INCOME
0.0/ 100
METRIC RATING
324th/ 347
METRIC RANK
$36,849
PER CAPITA INCOME
0.0/ 100
METRIC RATING
306th/ 347
METRIC RANK
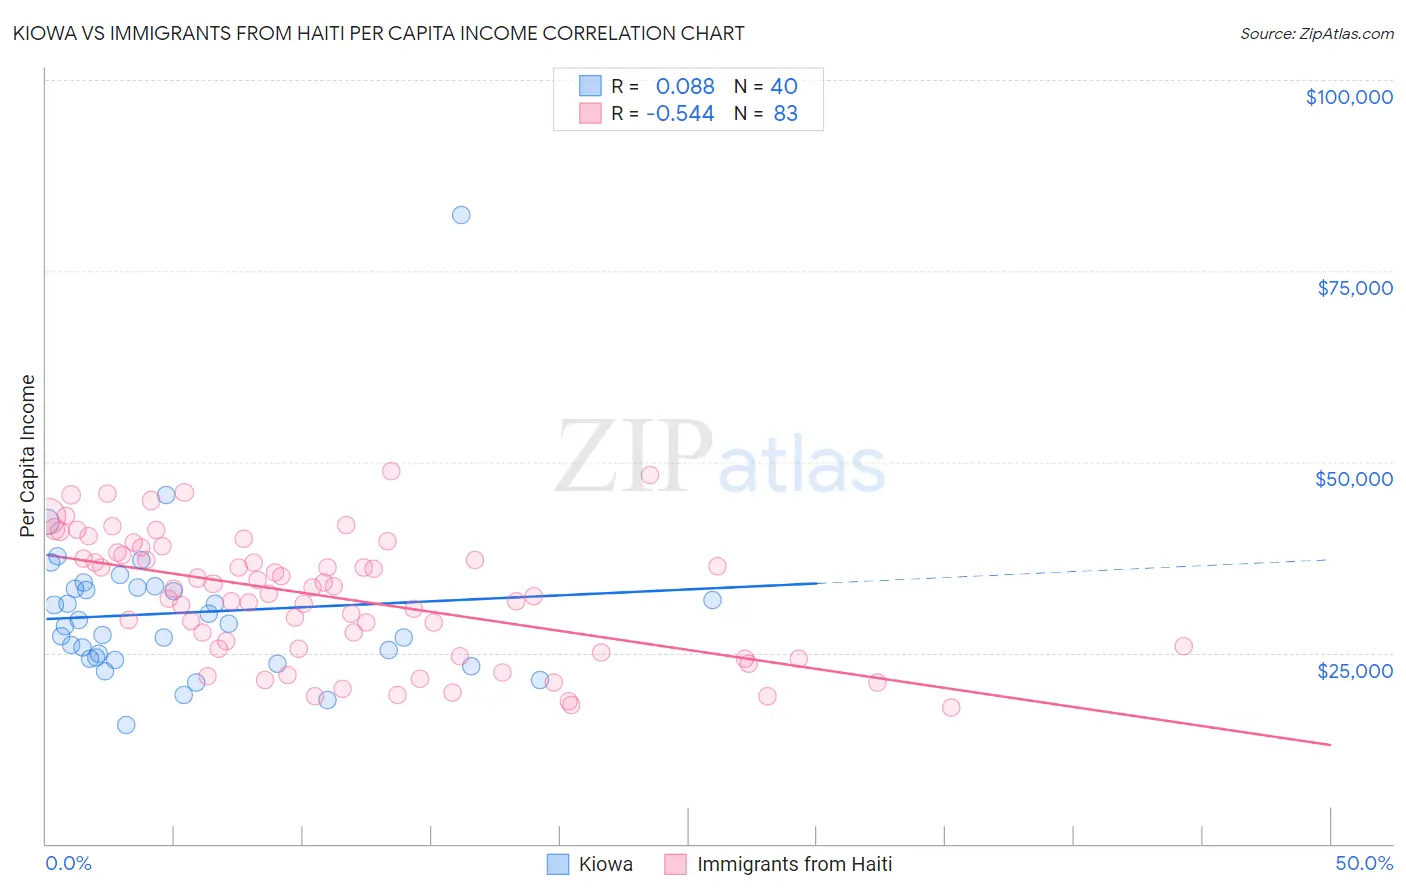
Kiowa vs Immigrants from Haiti Per Capita Income Correlation Chart
The statistical analysis conducted on geographies consisting of 56,101,664 people shows a slight positive correlation between the proportion of Kiowa and per capita income in the United States with a correlation coefficient (R) of 0.088 and weighted average of $35,102. Similarly, the statistical analysis conducted on geographies consisting of 225,290,875 people shows a substantial negative correlation between the proportion of Immigrants from Haiti and per capita income in the United States with a correlation coefficient (R) of -0.544 and weighted average of $36,849, a difference of 5.0%.
Per Capita Income Correlation Summary
| Measurement | Kiowa | Immigrants from Haiti |
| Minimum | $15,468 | $17,858 |
| Maximum | $82,387 | $48,799 |
| Range | $66,919 | $30,941 |
| Mean | $30,249 | $32,340 |
| Median | $28,572 | $33,392 |
| Interquartile 25% (IQ1) | $24,302 | $25,569 |
| Interquartile 75% (IQ3) | $33,441 | $38,157 |
| Interquartile Range (IQR) | $9,140 | $12,588 |
| Standard Deviation (Sample) | $10,578 | $8,072 |
| Standard Deviation (Population) | $10,445 | $8,023 |
Demographics Similar to Kiowa and Immigrants from Haiti by Per Capita Income
In terms of per capita income, the demographic groups most similar to Kiowa are Immigrants from Central America ($34,974, a difference of 0.37%), Cheyenne ($35,276, a difference of 0.50%), Creek ($35,546, a difference of 1.3%), Black/African American ($35,564, a difference of 1.3%), and Hispanic or Latino ($35,688, a difference of 1.7%). Similarly, the demographic groups most similar to Immigrants from Haiti are Immigrants from Latin America ($36,823, a difference of 0.070%), Inupiat ($36,999, a difference of 0.41%), Fijian ($36,690, a difference of 0.43%), Immigrants from Honduras ($36,665, a difference of 0.50%), and Ute ($36,651, a difference of 0.54%).
| Demographics | Rating | Rank | Per Capita Income |
| Inupiat | 0.1 /100 | #305 | Tragic $36,999 |
| Immigrants | Haiti | 0.0 /100 | #306 | Tragic $36,849 |
| Immigrants | Latin America | 0.0 /100 | #307 | Tragic $36,823 |
| Fijians | 0.0 /100 | #308 | Tragic $36,690 |
| Immigrants | Honduras | 0.0 /100 | #309 | Tragic $36,665 |
| Ute | 0.0 /100 | #310 | Tragic $36,651 |
| Chippewa | 0.0 /100 | #311 | Tragic $36,631 |
| Chickasaw | 0.0 /100 | #312 | Tragic $36,475 |
| Bahamians | 0.0 /100 | #313 | Tragic $36,427 |
| Seminole | 0.0 /100 | #314 | Tragic $36,180 |
| Yaqui | 0.0 /100 | #315 | Tragic $36,112 |
| Choctaw | 0.0 /100 | #316 | Tragic $35,999 |
| Dutch West Indians | 0.0 /100 | #317 | Tragic $35,922 |
| Bangladeshis | 0.0 /100 | #318 | Tragic $35,897 |
| Immigrants | Congo | 0.0 /100 | #319 | Tragic $35,720 |
| Hispanics or Latinos | 0.0 /100 | #320 | Tragic $35,688 |
| Blacks/African Americans | 0.0 /100 | #321 | Tragic $35,564 |
| Creek | 0.0 /100 | #322 | Tragic $35,546 |
| Cheyenne | 0.0 /100 | #323 | Tragic $35,276 |
| Kiowa | 0.0 /100 | #324 | Tragic $35,102 |
| Immigrants | Central America | 0.0 /100 | #325 | Tragic $34,974 |