African vs Immigrants from Haiti Per Capita Income
COMPARE
African
Immigrants from Haiti
Per Capita Income
Per Capita Income Comparison
Africans
Immigrants from Haiti
$37,785
PER CAPITA INCOME
0.1/ 100
METRIC RATING
284th/ 347
METRIC RANK
$36,849
PER CAPITA INCOME
0.0/ 100
METRIC RATING
306th/ 347
METRIC RANK
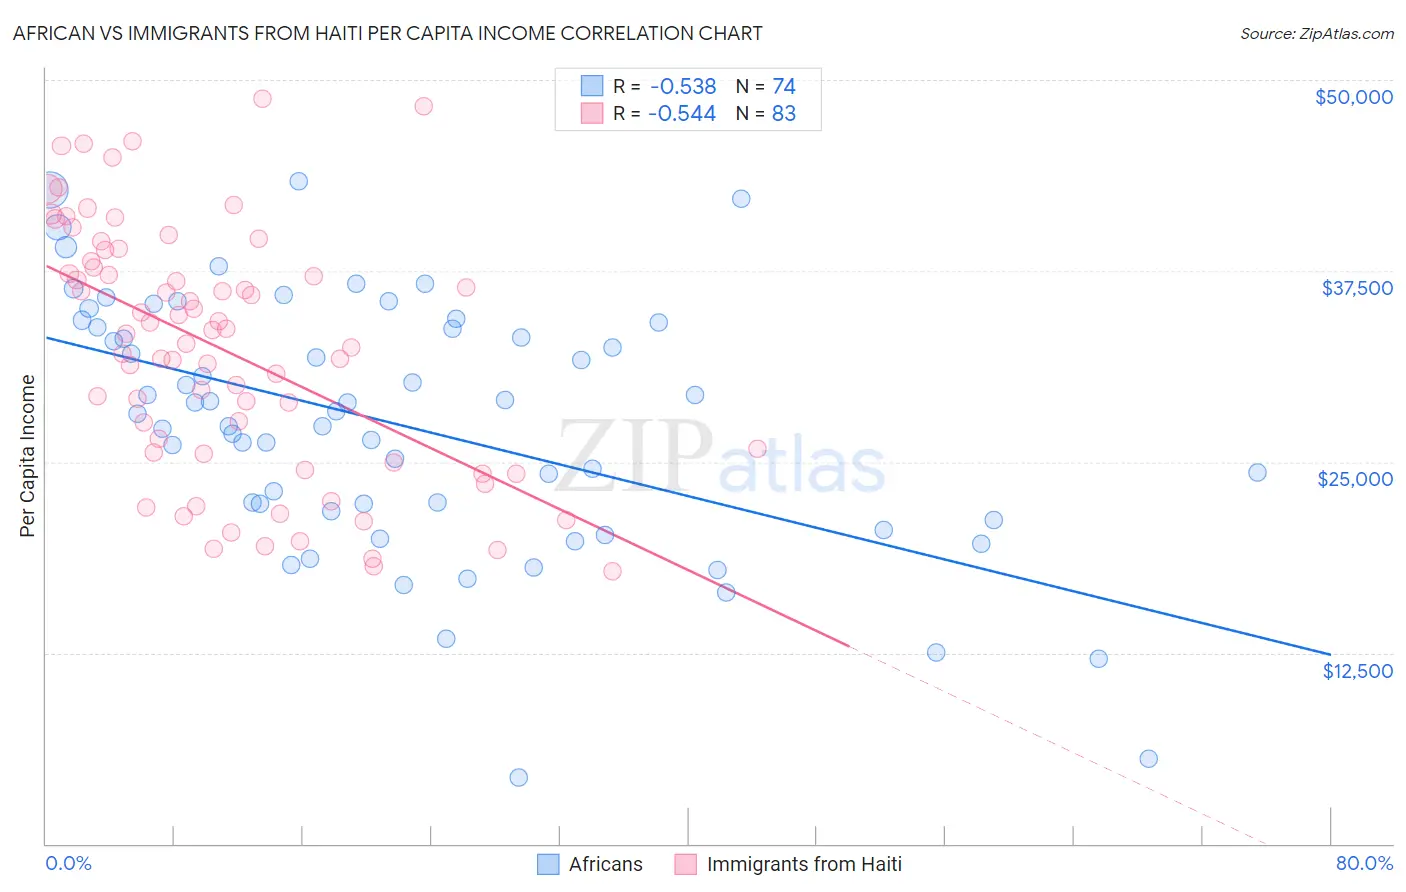
African vs Immigrants from Haiti Per Capita Income Correlation Chart
The statistical analysis conducted on geographies consisting of 470,145,104 people shows a substantial negative correlation between the proportion of Africans and per capita income in the United States with a correlation coefficient (R) of -0.538 and weighted average of $37,785. Similarly, the statistical analysis conducted on geographies consisting of 225,290,875 people shows a substantial negative correlation between the proportion of Immigrants from Haiti and per capita income in the United States with a correlation coefficient (R) of -0.544 and weighted average of $36,849, a difference of 2.5%.
Per Capita Income Correlation Summary
| Measurement | African | Immigrants from Haiti |
| Minimum | $4,302 | $17,858 |
| Maximum | $43,354 | $48,799 |
| Range | $39,052 | $30,941 |
| Mean | $27,384 | $32,340 |
| Median | $28,229 | $33,392 |
| Interquartile 25% (IQ1) | $21,779 | $25,569 |
| Interquartile 75% (IQ3) | $33,791 | $38,157 |
| Interquartile Range (IQR) | $12,012 | $12,588 |
| Standard Deviation (Sample) | $8,322 | $8,072 |
| Standard Deviation (Population) | $8,265 | $8,023 |
Similar Demographics by Per Capita Income
Demographics Similar to Africans by Per Capita Income
In terms of per capita income, the demographic groups most similar to Africans are Guatemalan ($37,766, a difference of 0.050%), Pennsylvania German ($37,842, a difference of 0.15%), Immigrants from Laos ($37,857, a difference of 0.19%), Central American Indian ($37,699, a difference of 0.23%), and Dominican ($37,697, a difference of 0.24%).
| Demographics | Rating | Rank | Per Capita Income |
| Comanche | 0.2 /100 | #277 | Tragic $38,088 |
| Immigrants | Nicaragua | 0.2 /100 | #278 | Tragic $38,065 |
| Colville | 0.2 /100 | #279 | Tragic $38,047 |
| Potawatomi | 0.2 /100 | #280 | Tragic $38,046 |
| Immigrants | Dominica | 0.2 /100 | #281 | Tragic $37,952 |
| Immigrants | Laos | 0.1 /100 | #282 | Tragic $37,857 |
| Pennsylvania Germans | 0.1 /100 | #283 | Tragic $37,842 |
| Africans | 0.1 /100 | #284 | Tragic $37,785 |
| Guatemalans | 0.1 /100 | #285 | Tragic $37,766 |
| Central American Indians | 0.1 /100 | #286 | Tragic $37,699 |
| Dominicans | 0.1 /100 | #287 | Tragic $37,697 |
| Blackfeet | 0.1 /100 | #288 | Tragic $37,695 |
| U.S. Virgin Islanders | 0.1 /100 | #289 | Tragic $37,589 |
| Immigrants | Guatemala | 0.1 /100 | #290 | Tragic $37,550 |
| Cajuns | 0.1 /100 | #291 | Tragic $37,527 |
Demographics Similar to Immigrants from Haiti by Per Capita Income
In terms of per capita income, the demographic groups most similar to Immigrants from Haiti are Immigrants from Latin America ($36,823, a difference of 0.070%), Inupiat ($36,999, a difference of 0.41%), Fijian ($36,690, a difference of 0.43%), Honduran ($37,031, a difference of 0.49%), and Immigrants from Honduras ($36,665, a difference of 0.50%).
| Demographics | Rating | Rank | Per Capita Income |
| Cherokee | 0.1 /100 | #299 | Tragic $37,203 |
| Immigrants | Bahamas | 0.1 /100 | #300 | Tragic $37,193 |
| Ottawa | 0.1 /100 | #301 | Tragic $37,101 |
| Shoshone | 0.1 /100 | #302 | Tragic $37,072 |
| Paiute | 0.1 /100 | #303 | Tragic $37,066 |
| Hondurans | 0.1 /100 | #304 | Tragic $37,031 |
| Inupiat | 0.1 /100 | #305 | Tragic $36,999 |
| Immigrants | Haiti | 0.0 /100 | #306 | Tragic $36,849 |
| Immigrants | Latin America | 0.0 /100 | #307 | Tragic $36,823 |
| Fijians | 0.0 /100 | #308 | Tragic $36,690 |
| Immigrants | Honduras | 0.0 /100 | #309 | Tragic $36,665 |
| Ute | 0.0 /100 | #310 | Tragic $36,651 |
| Chippewa | 0.0 /100 | #311 | Tragic $36,631 |
| Chickasaw | 0.0 /100 | #312 | Tragic $36,475 |
| Bahamians | 0.0 /100 | #313 | Tragic $36,427 |