British West Indian vs Immigrants from Syria Median Family Income
COMPARE
British West Indian
Immigrants from Syria
Median Family Income
Median Family Income Comparison
British West Indians
Immigrants from Syria
$88,987
MEDIAN FAMILY INCOME
0.1/ 100
METRIC RATING
280th/ 347
METRIC RANK
$106,118
MEDIAN FAMILY INCOME
85.3/ 100
METRIC RATING
141st/ 347
METRIC RANK
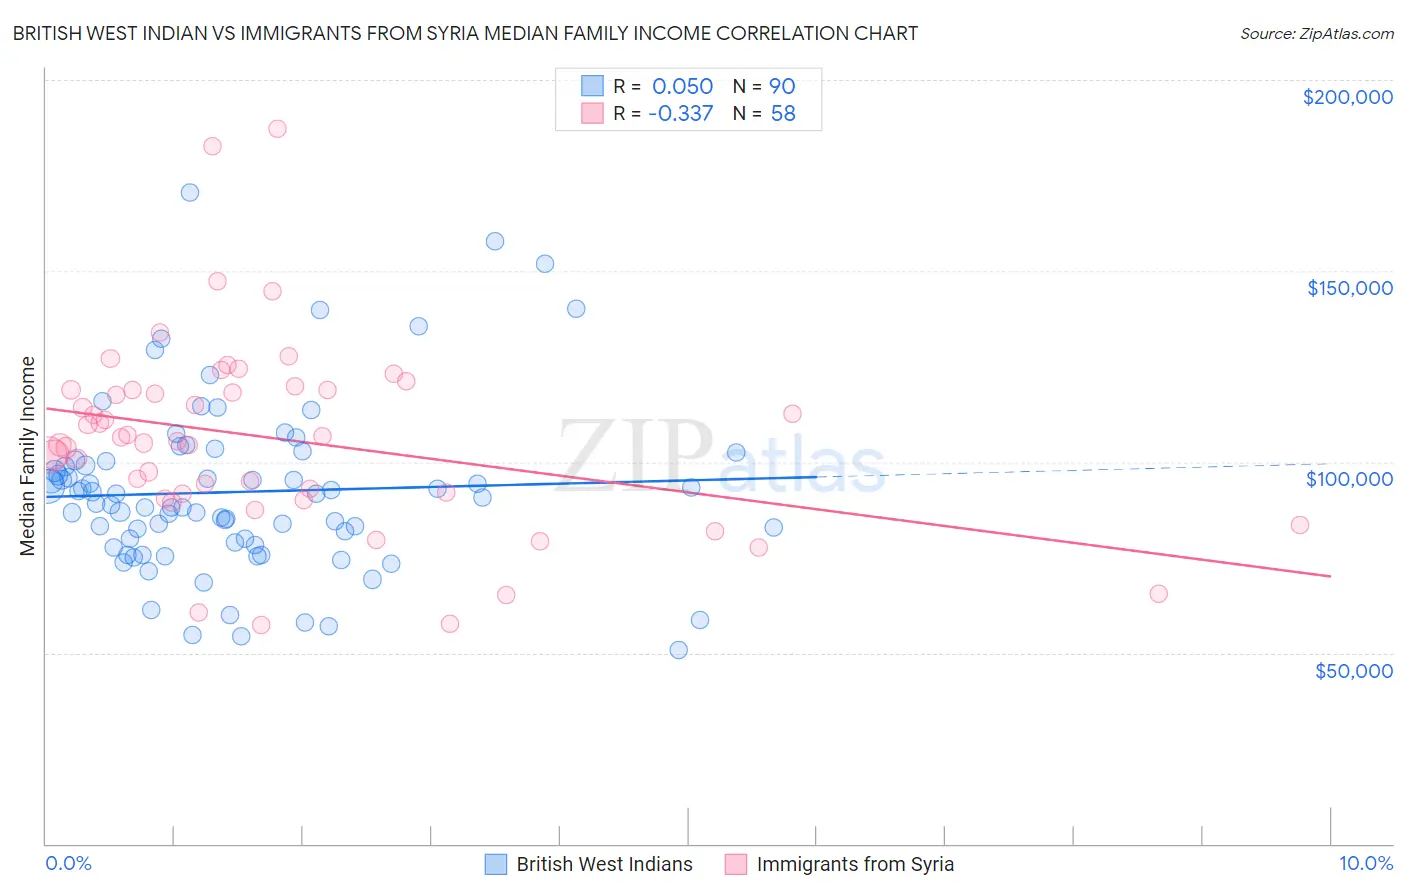
British West Indian vs Immigrants from Syria Median Family Income Correlation Chart
The statistical analysis conducted on geographies consisting of 152,609,449 people shows no correlation between the proportion of British West Indians and median family income in the United States with a correlation coefficient (R) of 0.050 and weighted average of $88,987. Similarly, the statistical analysis conducted on geographies consisting of 174,073,283 people shows a mild negative correlation between the proportion of Immigrants from Syria and median family income in the United States with a correlation coefficient (R) of -0.337 and weighted average of $106,118, a difference of 19.3%.
Median Family Income Correlation Summary
| Measurement | British West Indian | Immigrants from Syria |
| Minimum | $50,788 | $57,198 |
| Maximum | $170,703 | $187,321 |
| Range | $119,915 | $130,123 |
| Mean | $92,168 | $106,113 |
| Median | $89,815 | $105,890 |
| Interquartile 25% (IQ1) | $78,814 | $91,647 |
| Interquartile 75% (IQ3) | $100,192 | $118,687 |
| Interquartile Range (IQR) | $21,378 | $27,040 |
| Standard Deviation (Sample) | $22,307 | $25,104 |
| Standard Deviation (Population) | $22,182 | $24,886 |
Similar Demographics by Median Family Income
Demographics Similar to British West Indians by Median Family Income
In terms of median family income, the demographic groups most similar to British West Indians are Immigrants from Belize ($89,197, a difference of 0.24%), Immigrants from Grenada ($89,249, a difference of 0.29%), Blackfeet ($88,717, a difference of 0.30%), Immigrants from Jamaica ($89,268, a difference of 0.32%), and Immigrants from Zaire ($89,285, a difference of 0.33%).
| Demographics | Rating | Rank | Median Family Income |
| Immigrants | Micronesia | 0.2 /100 | #273 | Tragic $90,345 |
| Spanish Americans | 0.2 /100 | #274 | Tragic $90,322 |
| Immigrants | St. Vincent and the Grenadines | 0.2 /100 | #275 | Tragic $90,094 |
| Immigrants | Zaire | 0.1 /100 | #276 | Tragic $89,285 |
| Immigrants | Jamaica | 0.1 /100 | #277 | Tragic $89,268 |
| Immigrants | Grenada | 0.1 /100 | #278 | Tragic $89,249 |
| Immigrants | Belize | 0.1 /100 | #279 | Tragic $89,197 |
| British West Indians | 0.1 /100 | #280 | Tragic $88,987 |
| Blackfeet | 0.1 /100 | #281 | Tragic $88,717 |
| Comanche | 0.1 /100 | #282 | Tragic $88,556 |
| Bangladeshis | 0.1 /100 | #283 | Tragic $88,358 |
| Indonesians | 0.1 /100 | #284 | Tragic $88,301 |
| Guatemalans | 0.1 /100 | #285 | Tragic $88,295 |
| Immigrants | Nicaragua | 0.1 /100 | #286 | Tragic $88,267 |
| Potawatomi | 0.1 /100 | #287 | Tragic $88,265 |
Demographics Similar to Immigrants from Syria by Median Family Income
In terms of median family income, the demographic groups most similar to Immigrants from Syria are Norwegian ($106,144, a difference of 0.020%), Immigrants from Vietnam ($106,186, a difference of 0.060%), Luxembourger ($106,183, a difference of 0.060%), Immigrants from Uganda ($106,188, a difference of 0.070%), and Slovene ($106,020, a difference of 0.090%).
| Demographics | Rating | Rank | Median Family Income |
| Immigrants | Oceania | 87.3 /100 | #134 | Excellent $106,453 |
| Portuguese | 86.3 /100 | #135 | Excellent $106,286 |
| Immigrants | South Eastern Asia | 86.1 /100 | #136 | Excellent $106,252 |
| Immigrants | Uganda | 85.7 /100 | #137 | Excellent $106,188 |
| Immigrants | Vietnam | 85.7 /100 | #138 | Excellent $106,186 |
| Luxembourgers | 85.7 /100 | #139 | Excellent $106,183 |
| Norwegians | 85.5 /100 | #140 | Excellent $106,144 |
| Immigrants | Syria | 85.3 /100 | #141 | Excellent $106,118 |
| Slovenes | 84.7 /100 | #142 | Excellent $106,020 |
| Tongans | 84.3 /100 | #143 | Excellent $105,967 |
| Immigrants | Morocco | 84.3 /100 | #144 | Excellent $105,964 |
| Danes | 83.8 /100 | #145 | Excellent $105,900 |
| Czechs | 83.4 /100 | #146 | Excellent $105,839 |
| Immigrants | Chile | 82.1 /100 | #147 | Excellent $105,655 |
| Hungarians | 81.7 /100 | #148 | Excellent $105,609 |