Immigrants from Romania vs Immigrants from Somalia Median Family Income
COMPARE
Immigrants from Romania
Immigrants from Somalia
Median Family Income
Median Family Income Comparison
Immigrants from Romania
Immigrants from Somalia
$113,434
MEDIAN FAMILY INCOME
99.6/ 100
METRIC RATING
70th/ 347
METRIC RANK
$92,609
MEDIAN FAMILY INCOME
0.6/ 100
METRIC RATING
251st/ 347
METRIC RANK
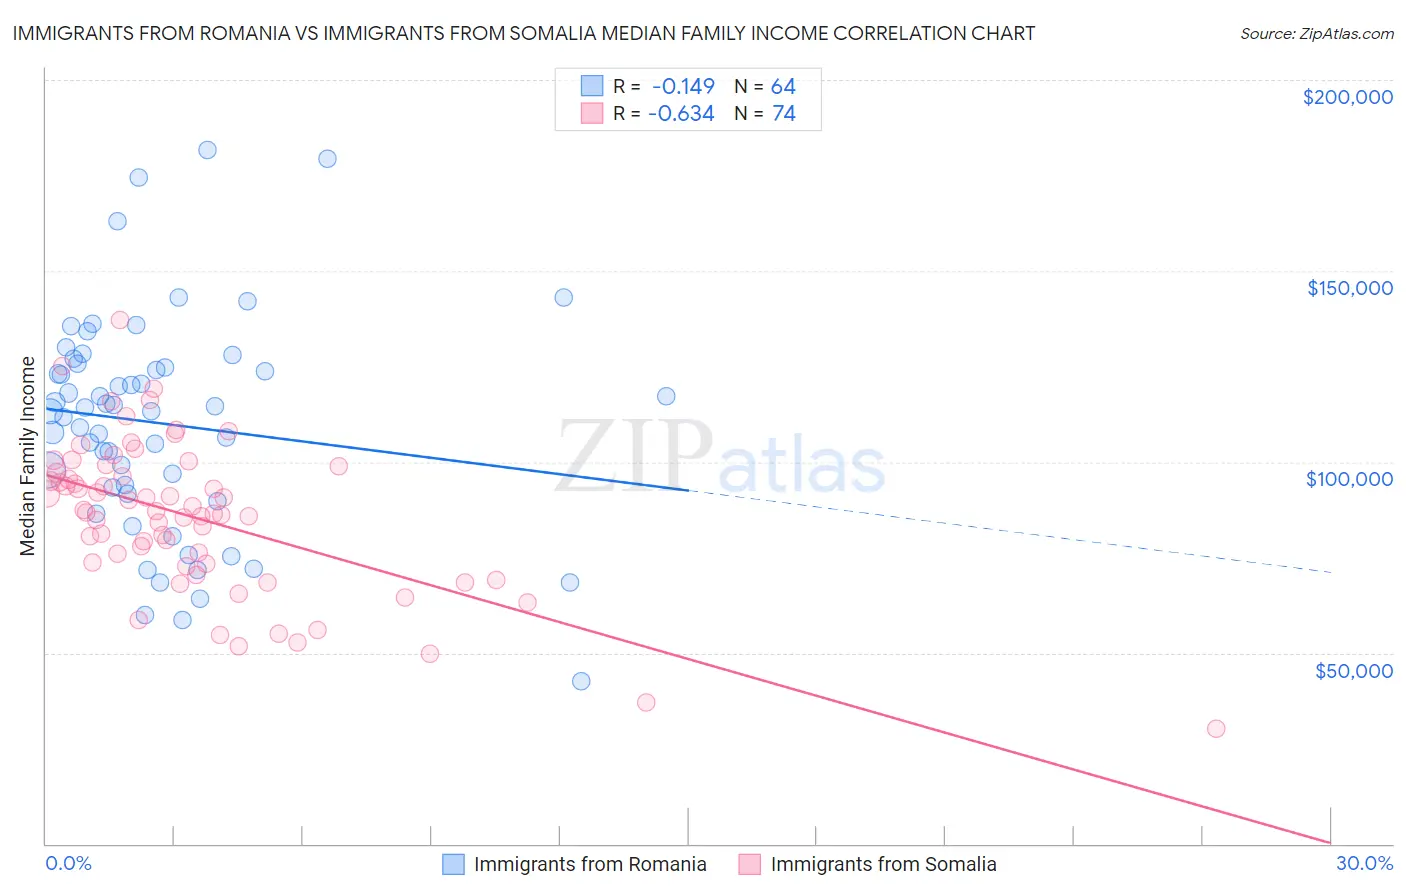
Immigrants from Romania vs Immigrants from Somalia Median Family Income Correlation Chart
The statistical analysis conducted on geographies consisting of 256,919,145 people shows a poor negative correlation between the proportion of Immigrants from Romania and median family income in the United States with a correlation coefficient (R) of -0.149 and weighted average of $113,434. Similarly, the statistical analysis conducted on geographies consisting of 92,093,839 people shows a significant negative correlation between the proportion of Immigrants from Somalia and median family income in the United States with a correlation coefficient (R) of -0.634 and weighted average of $92,609, a difference of 22.5%.
Median Family Income Correlation Summary
| Measurement | Immigrants from Romania | Immigrants from Somalia |
| Minimum | $42,500 | $29,978 |
| Maximum | $181,711 | $137,115 |
| Range | $139,211 | $107,137 |
| Mean | $109,959 | $85,390 |
| Median | $113,781 | $86,897 |
| Interquartile 25% (IQ1) | $92,391 | $73,310 |
| Interquartile 75% (IQ3) | $125,210 | $97,167 |
| Interquartile Range (IQR) | $32,820 | $23,857 |
| Standard Deviation (Sample) | $28,709 | $19,854 |
| Standard Deviation (Population) | $28,484 | $19,720 |
Similar Demographics by Median Family Income
Demographics Similar to Immigrants from Romania by Median Family Income
In terms of median family income, the demographic groups most similar to Immigrants from Romania are Immigrants from Bulgaria ($113,461, a difference of 0.020%), Immigrants from Serbia ($113,463, a difference of 0.030%), South African ($113,229, a difference of 0.18%), Immigrants from Spain ($113,815, a difference of 0.34%), and Afghan ($112,971, a difference of 0.41%).
| Demographics | Rating | Rank | Median Family Income |
| Immigrants | Pakistan | 99.8 /100 | #63 | Exceptional $114,406 |
| Immigrants | Scotland | 99.7 /100 | #64 | Exceptional $114,392 |
| Egyptians | 99.7 /100 | #65 | Exceptional $114,119 |
| Paraguayans | 99.7 /100 | #66 | Exceptional $114,016 |
| Immigrants | Spain | 99.7 /100 | #67 | Exceptional $113,815 |
| Immigrants | Serbia | 99.6 /100 | #68 | Exceptional $113,463 |
| Immigrants | Bulgaria | 99.6 /100 | #69 | Exceptional $113,461 |
| Immigrants | Romania | 99.6 /100 | #70 | Exceptional $113,434 |
| South Africans | 99.5 /100 | #71 | Exceptional $113,229 |
| Afghans | 99.5 /100 | #72 | Exceptional $112,971 |
| Laotians | 99.5 /100 | #73 | Exceptional $112,859 |
| Immigrants | Italy | 99.4 /100 | #74 | Exceptional $112,848 |
| Immigrants | Western Europe | 99.4 /100 | #75 | Exceptional $112,688 |
| Argentineans | 99.4 /100 | #76 | Exceptional $112,665 |
| Immigrants | Eastern Europe | 99.4 /100 | #77 | Exceptional $112,527 |
Demographics Similar to Immigrants from Somalia by Median Family Income
In terms of median family income, the demographic groups most similar to Immigrants from Somalia are Immigrants from El Salvador ($92,545, a difference of 0.070%), Immigrants from Guyana ($92,513, a difference of 0.10%), West Indian ($92,765, a difference of 0.17%), Immigrants from Barbados ($92,419, a difference of 0.21%), and Immigrants from Ecuador ($92,837, a difference of 0.25%).
| Demographics | Rating | Rank | Median Family Income |
| Sub-Saharan Africans | 1.0 /100 | #244 | Tragic $93,748 |
| Immigrants | Middle Africa | 1.0 /100 | #245 | Tragic $93,593 |
| Guyanese | 0.9 /100 | #246 | Tragic $93,373 |
| Immigrants | Senegal | 0.7 /100 | #247 | Tragic $92,912 |
| French American Indians | 0.7 /100 | #248 | Tragic $92,872 |
| Immigrants | Ecuador | 0.7 /100 | #249 | Tragic $92,837 |
| West Indians | 0.6 /100 | #250 | Tragic $92,765 |
| Immigrants | Somalia | 0.6 /100 | #251 | Tragic $92,609 |
| Immigrants | El Salvador | 0.6 /100 | #252 | Tragic $92,545 |
| Immigrants | Guyana | 0.6 /100 | #253 | Tragic $92,513 |
| Immigrants | Barbados | 0.5 /100 | #254 | Tragic $92,419 |
| Immigrants | Laos | 0.5 /100 | #255 | Tragic $92,239 |
| Nicaraguans | 0.5 /100 | #256 | Tragic $92,231 |
| Americans | 0.4 /100 | #257 | Tragic $92,096 |
| Osage | 0.4 /100 | #258 | Tragic $91,926 |