Bhutanese vs Immigrants from Somalia Unemployment Among Women with Children Under 18 years
COMPARE
Bhutanese
Immigrants from Somalia
Unemployment Among Women with Children Under 18 years
Unemployment Among Women with Children Under 18 years Comparison
Bhutanese
Immigrants from Somalia
5.0%
UNEMPLOYMENT AMONG WOMEN WITH CHILDREN UNDER 18 YEARS
99.2/ 100
METRIC RATING
38th/ 347
METRIC RANK
5.8%
UNEMPLOYMENT AMONG WOMEN WITH CHILDREN UNDER 18 YEARS
2.2/ 100
METRIC RATING
238th/ 347
METRIC RANK
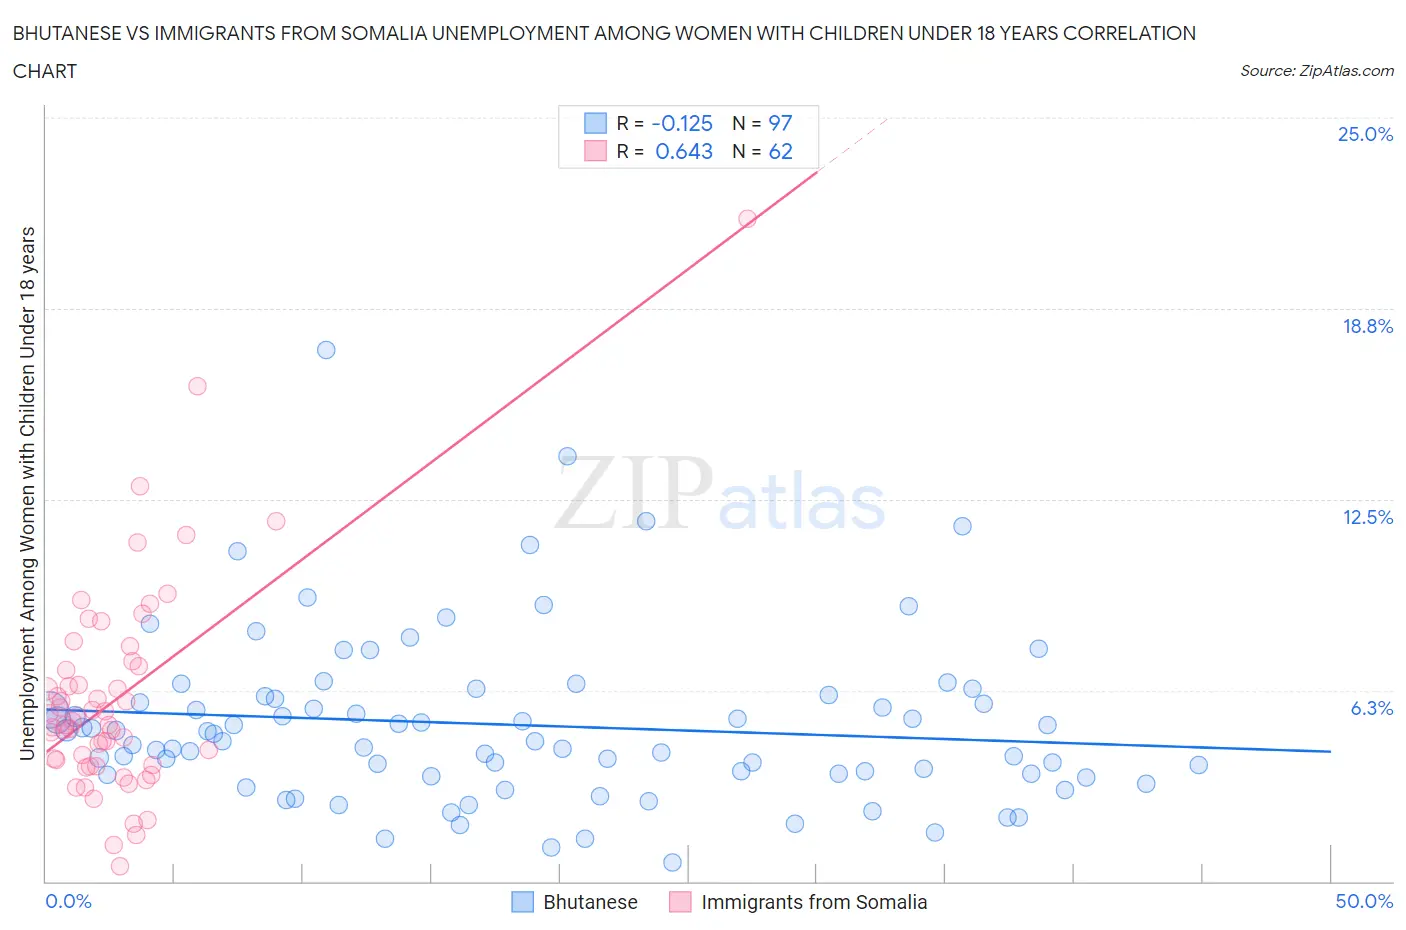
Bhutanese vs Immigrants from Somalia Unemployment Among Women with Children Under 18 years Correlation Chart
The statistical analysis conducted on geographies consisting of 433,070,869 people shows a poor negative correlation between the proportion of Bhutanese and unemployment rate among women with children under the age of 18 in the United States with a correlation coefficient (R) of -0.125 and weighted average of 5.0%. Similarly, the statistical analysis conducted on geographies consisting of 91,122,475 people shows a significant positive correlation between the proportion of Immigrants from Somalia and unemployment rate among women with children under the age of 18 in the United States with a correlation coefficient (R) of 0.643 and weighted average of 5.8%, a difference of 16.7%.
Unemployment Among Women with Children Under 18 years Correlation Summary
| Measurement | Bhutanese | Immigrants from Somalia |
| Minimum | 0.60% | 0.50% |
| Maximum | 17.4% | 21.7% |
| Range | 16.8% | 21.2% |
| Mean | 5.1% | 6.0% |
| Median | 4.6% | 5.2% |
| Interquartile 25% (IQ1) | 3.5% | 3.8% |
| Interquartile 75% (IQ3) | 6.0% | 7.0% |
| Interquartile Range (IQR) | 2.5% | 3.2% |
| Standard Deviation (Sample) | 2.8% | 3.5% |
| Standard Deviation (Population) | 2.7% | 3.5% |
Similar Demographics by Unemployment Among Women with Children Under 18 years
Demographics Similar to Bhutanese by Unemployment Among Women with Children Under 18 years
In terms of unemployment among women with children under 18 years, the demographic groups most similar to Bhutanese are Polish (5.0%, a difference of 0.030%), Mongolian (5.0%, a difference of 0.050%), English (5.0%, a difference of 0.10%), Luxembourger (5.0%, a difference of 0.11%), and Immigrants from South Central Asia (5.0%, a difference of 0.16%).
| Demographics | Rating | Rank | Unemployment Among Women with Children Under 18 years |
| Cypriots | 99.3 /100 | #31 | Exceptional 5.0% |
| Dutch | 99.3 /100 | #32 | Exceptional 5.0% |
| Croatians | 99.3 /100 | #33 | Exceptional 5.0% |
| Immigrants | South Central Asia | 99.2 /100 | #34 | Exceptional 5.0% |
| Luxembourgers | 99.2 /100 | #35 | Exceptional 5.0% |
| Mongolians | 99.2 /100 | #36 | Exceptional 5.0% |
| Poles | 99.2 /100 | #37 | Exceptional 5.0% |
| Bhutanese | 99.2 /100 | #38 | Exceptional 5.0% |
| English | 99.1 /100 | #39 | Exceptional 5.0% |
| Greeks | 99.0 /100 | #40 | Exceptional 5.0% |
| Immigrants | Bosnia and Herzegovina | 99.0 /100 | #41 | Exceptional 5.0% |
| Eastern Europeans | 98.9 /100 | #42 | Exceptional 5.0% |
| Turks | 98.9 /100 | #43 | Exceptional 5.0% |
| Immigrants | Moldova | 98.9 /100 | #44 | Exceptional 5.0% |
| Immigrants | Malaysia | 98.8 /100 | #45 | Exceptional 5.0% |
Demographics Similar to Immigrants from Somalia by Unemployment Among Women with Children Under 18 years
In terms of unemployment among women with children under 18 years, the demographic groups most similar to Immigrants from Somalia are Immigrants from Sierra Leone (5.8%, a difference of 0.080%), Immigrants (5.8%, a difference of 0.090%), Immigrants from Lebanon (5.8%, a difference of 0.19%), Alsatian (5.8%, a difference of 0.28%), and Immigrants from Middle Africa (5.8%, a difference of 0.46%).
| Demographics | Rating | Rank | Unemployment Among Women with Children Under 18 years |
| Immigrants | Africa | 3.1 /100 | #231 | Tragic 5.8% |
| Creek | 3.1 /100 | #232 | Tragic 5.8% |
| Spanish Americans | 3.1 /100 | #233 | Tragic 5.8% |
| Guamanians/Chamorros | 2.9 /100 | #234 | Tragic 5.8% |
| Immigrants | Middle Africa | 2.8 /100 | #235 | Tragic 5.8% |
| Alsatians | 2.5 /100 | #236 | Tragic 5.8% |
| Immigrants | Lebanon | 2.4 /100 | #237 | Tragic 5.8% |
| Immigrants | Somalia | 2.2 /100 | #238 | Tragic 5.8% |
| Immigrants | Sierra Leone | 2.0 /100 | #239 | Tragic 5.8% |
| Immigrants | Immigrants | 2.0 /100 | #240 | Tragic 5.8% |
| Brazilians | 1.6 /100 | #241 | Tragic 5.8% |
| Moroccans | 1.4 /100 | #242 | Tragic 5.9% |
| Immigrants | Uruguay | 1.1 /100 | #243 | Tragic 5.9% |
| Choctaw | 1.1 /100 | #244 | Tragic 5.9% |
| Ugandans | 1.1 /100 | #245 | Tragic 5.9% |