Lebanese vs Immigrants from Somalia Median Family Income
COMPARE
Lebanese
Immigrants from Somalia
Median Family Income
Median Family Income Comparison
Lebanese
Immigrants from Somalia
$107,086
MEDIAN FAMILY INCOME
90.5/ 100
METRIC RATING
127th/ 347
METRIC RANK
$92,609
MEDIAN FAMILY INCOME
0.6/ 100
METRIC RATING
251st/ 347
METRIC RANK
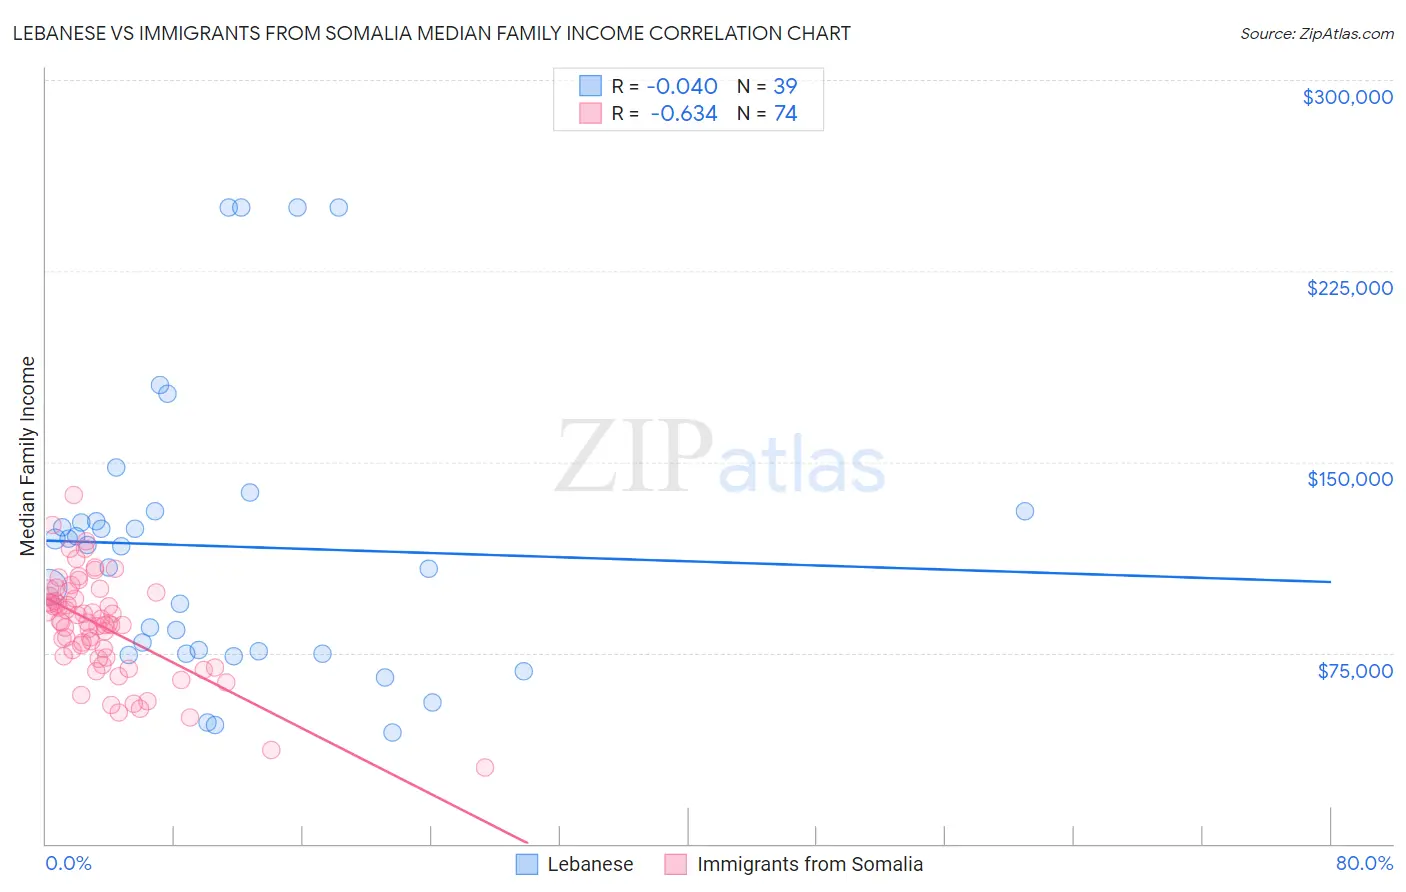
Lebanese vs Immigrants from Somalia Median Family Income Correlation Chart
The statistical analysis conducted on geographies consisting of 401,188,092 people shows no correlation between the proportion of Lebanese and median family income in the United States with a correlation coefficient (R) of -0.040 and weighted average of $107,086. Similarly, the statistical analysis conducted on geographies consisting of 92,093,839 people shows a significant negative correlation between the proportion of Immigrants from Somalia and median family income in the United States with a correlation coefficient (R) of -0.634 and weighted average of $92,609, a difference of 15.6%.
Median Family Income Correlation Summary
| Measurement | Lebanese | Immigrants from Somalia |
| Minimum | $43,594 | $29,978 |
| Maximum | $250,001 | $137,115 |
| Range | $206,407 | $107,137 |
| Mean | $116,877 | $85,390 |
| Median | $116,743 | $86,897 |
| Interquartile 25% (IQ1) | $74,798 | $73,310 |
| Interquartile 75% (IQ3) | $130,372 | $97,167 |
| Interquartile Range (IQR) | $55,574 | $23,857 |
| Standard Deviation (Sample) | $56,099 | $19,854 |
| Standard Deviation (Population) | $55,375 | $19,720 |
Similar Demographics by Median Family Income
Demographics Similar to Lebanese by Median Family Income
In terms of median family income, the demographic groups most similar to Lebanese are Serbian ($107,157, a difference of 0.070%), Immigrants from Ethiopia ($106,969, a difference of 0.11%), Arab ($106,952, a difference of 0.12%), Brazilian ($106,942, a difference of 0.13%), and Taiwanese ($107,295, a difference of 0.19%).
| Demographics | Rating | Rank | Median Family Income |
| Immigrants | Northern Africa | 94.3 /100 | #120 | Exceptional $108,161 |
| Europeans | 94.1 /100 | #121 | Exceptional $108,099 |
| Immigrants | Jordan | 92.9 /100 | #122 | Exceptional $107,715 |
| Carpatho Rusyns | 92.2 /100 | #123 | Exceptional $107,502 |
| Pakistanis | 91.7 /100 | #124 | Exceptional $107,390 |
| Taiwanese | 91.4 /100 | #125 | Exceptional $107,295 |
| Serbians | 90.8 /100 | #126 | Exceptional $107,157 |
| Lebanese | 90.5 /100 | #127 | Exceptional $107,086 |
| Immigrants | Ethiopia | 90.0 /100 | #128 | Excellent $106,969 |
| Arabs | 89.9 /100 | #129 | Excellent $106,952 |
| Brazilians | 89.8 /100 | #130 | Excellent $106,942 |
| Canadians | 88.1 /100 | #131 | Excellent $106,597 |
| Immigrants | Fiji | 87.8 /100 | #132 | Excellent $106,544 |
| Ugandans | 87.8 /100 | #133 | Excellent $106,541 |
| Immigrants | Oceania | 87.3 /100 | #134 | Excellent $106,453 |
Demographics Similar to Immigrants from Somalia by Median Family Income
In terms of median family income, the demographic groups most similar to Immigrants from Somalia are Immigrants from El Salvador ($92,545, a difference of 0.070%), Immigrants from Guyana ($92,513, a difference of 0.10%), West Indian ($92,765, a difference of 0.17%), Immigrants from Barbados ($92,419, a difference of 0.21%), and Immigrants from Ecuador ($92,837, a difference of 0.25%).
| Demographics | Rating | Rank | Median Family Income |
| Sub-Saharan Africans | 1.0 /100 | #244 | Tragic $93,748 |
| Immigrants | Middle Africa | 1.0 /100 | #245 | Tragic $93,593 |
| Guyanese | 0.9 /100 | #246 | Tragic $93,373 |
| Immigrants | Senegal | 0.7 /100 | #247 | Tragic $92,912 |
| French American Indians | 0.7 /100 | #248 | Tragic $92,872 |
| Immigrants | Ecuador | 0.7 /100 | #249 | Tragic $92,837 |
| West Indians | 0.6 /100 | #250 | Tragic $92,765 |
| Immigrants | Somalia | 0.6 /100 | #251 | Tragic $92,609 |
| Immigrants | El Salvador | 0.6 /100 | #252 | Tragic $92,545 |
| Immigrants | Guyana | 0.6 /100 | #253 | Tragic $92,513 |
| Immigrants | Barbados | 0.5 /100 | #254 | Tragic $92,419 |
| Immigrants | Laos | 0.5 /100 | #255 | Tragic $92,239 |
| Nicaraguans | 0.5 /100 | #256 | Tragic $92,231 |
| Americans | 0.4 /100 | #257 | Tragic $92,096 |
| Osage | 0.4 /100 | #258 | Tragic $91,926 |