Hopi vs Immigrants from Scotland Median Family Income
COMPARE
Hopi
Immigrants from Scotland
Median Family Income
Median Family Income Comparison
Hopi
Immigrants from Scotland
$77,188
MEDIAN FAMILY INCOME
0.0/ 100
METRIC RATING
340th/ 347
METRIC RANK
$114,392
MEDIAN FAMILY INCOME
99.7/ 100
METRIC RATING
64th/ 347
METRIC RANK
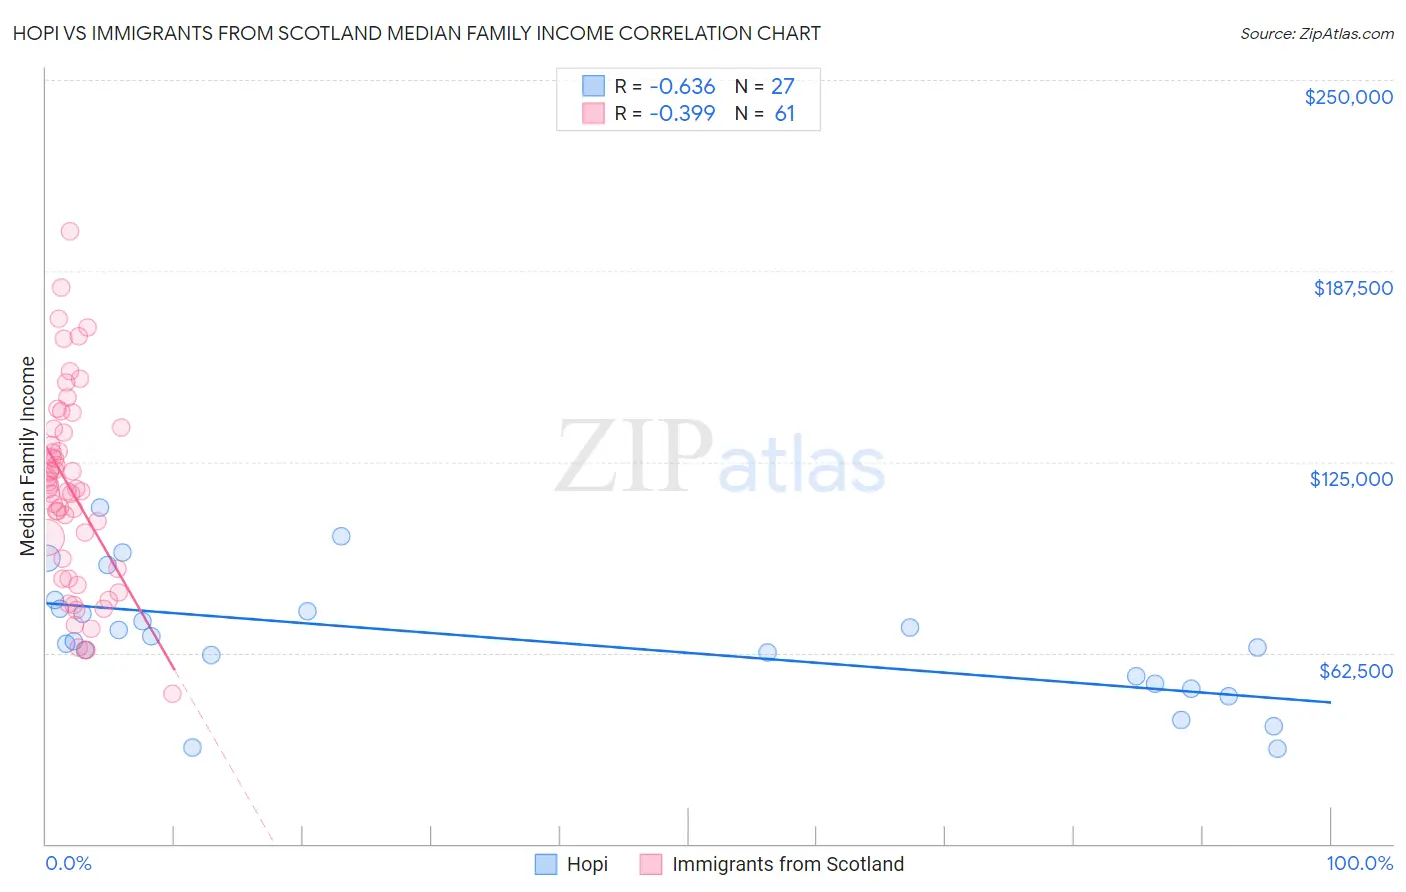
Hopi vs Immigrants from Scotland Median Family Income Correlation Chart
The statistical analysis conducted on geographies consisting of 74,729,125 people shows a significant negative correlation between the proportion of Hopi and median family income in the United States with a correlation coefficient (R) of -0.636 and weighted average of $77,188. Similarly, the statistical analysis conducted on geographies consisting of 196,366,880 people shows a mild negative correlation between the proportion of Immigrants from Scotland and median family income in the United States with a correlation coefficient (R) of -0.399 and weighted average of $114,392, a difference of 48.2%.
Median Family Income Correlation Summary
| Measurement | Hopi | Immigrants from Scotland |
| Minimum | $31,250 | $48,950 |
| Maximum | $109,922 | $200,376 |
| Range | $78,672 | $151,426 |
| Mean | $67,112 | $115,583 |
| Median | $66,093 | $116,250 |
| Interquartile 25% (IQ1) | $52,500 | $88,375 |
| Interquartile 75% (IQ3) | $76,955 | $135,291 |
| Interquartile Range (IQR) | $24,455 | $46,916 |
| Standard Deviation (Sample) | $20,243 | $31,941 |
| Standard Deviation (Population) | $19,865 | $31,678 |
Similar Demographics by Median Family Income
Demographics Similar to Hopi by Median Family Income
In terms of median family income, the demographic groups most similar to Hopi are Pima ($77,431, a difference of 0.32%), Immigrants from Yemen ($77,457, a difference of 0.35%), Pueblo ($76,880, a difference of 0.40%), Crow ($76,605, a difference of 0.76%), and Yuman ($78,055, a difference of 1.1%).
| Demographics | Rating | Rank | Median Family Income |
| Kiowa | 0.0 /100 | #333 | Tragic $80,885 |
| Menominee | 0.0 /100 | #334 | Tragic $79,563 |
| Yup'ik | 0.0 /100 | #335 | Tragic $79,290 |
| Immigrants | Cuba | 0.0 /100 | #336 | Tragic $78,249 |
| Yuman | 0.0 /100 | #337 | Tragic $78,055 |
| Immigrants | Yemen | 0.0 /100 | #338 | Tragic $77,457 |
| Pima | 0.0 /100 | #339 | Tragic $77,431 |
| Hopi | 0.0 /100 | #340 | Tragic $77,188 |
| Pueblo | 0.0 /100 | #341 | Tragic $76,880 |
| Crow | 0.0 /100 | #342 | Tragic $76,605 |
| Houma | 0.0 /100 | #343 | Tragic $76,188 |
| Tohono O'odham | 0.0 /100 | #344 | Tragic $72,193 |
| Navajo | 0.0 /100 | #345 | Tragic $70,989 |
| Puerto Ricans | 0.0 /100 | #346 | Tragic $70,423 |
| Lumbee | 0.0 /100 | #347 | Tragic $68,679 |
Demographics Similar to Immigrants from Scotland by Median Family Income
In terms of median family income, the demographic groups most similar to Immigrants from Scotland are Immigrants from Pakistan ($114,406, a difference of 0.010%), Mongolian ($114,553, a difference of 0.14%), Immigrants from Belarus ($114,586, a difference of 0.17%), Egyptian ($114,119, a difference of 0.24%), and Paraguayan ($114,016, a difference of 0.33%).
| Demographics | Rating | Rank | Median Family Income |
| Greeks | 99.8 /100 | #57 | Exceptional $115,192 |
| Immigrants | Indonesia | 99.8 /100 | #58 | Exceptional $115,162 |
| Immigrants | Netherlands | 99.8 /100 | #59 | Exceptional $114,987 |
| Immigrants | Latvia | 99.8 /100 | #60 | Exceptional $114,826 |
| Immigrants | Belarus | 99.8 /100 | #61 | Exceptional $114,586 |
| Mongolians | 99.8 /100 | #62 | Exceptional $114,553 |
| Immigrants | Pakistan | 99.8 /100 | #63 | Exceptional $114,406 |
| Immigrants | Scotland | 99.7 /100 | #64 | Exceptional $114,392 |
| Egyptians | 99.7 /100 | #65 | Exceptional $114,119 |
| Paraguayans | 99.7 /100 | #66 | Exceptional $114,016 |
| Immigrants | Spain | 99.7 /100 | #67 | Exceptional $113,815 |
| Immigrants | Serbia | 99.6 /100 | #68 | Exceptional $113,463 |
| Immigrants | Bulgaria | 99.6 /100 | #69 | Exceptional $113,461 |
| Immigrants | Romania | 99.6 /100 | #70 | Exceptional $113,434 |
| South Africans | 99.5 /100 | #71 | Exceptional $113,229 |