Immigrants from Morocco vs Immigrants from Scotland Median Family Income
COMPARE
Immigrants from Morocco
Immigrants from Scotland
Median Family Income
Median Family Income Comparison
Immigrants from Morocco
Immigrants from Scotland
$105,964
MEDIAN FAMILY INCOME
84.3/ 100
METRIC RATING
144th/ 347
METRIC RANK
$114,392
MEDIAN FAMILY INCOME
99.7/ 100
METRIC RATING
64th/ 347
METRIC RANK
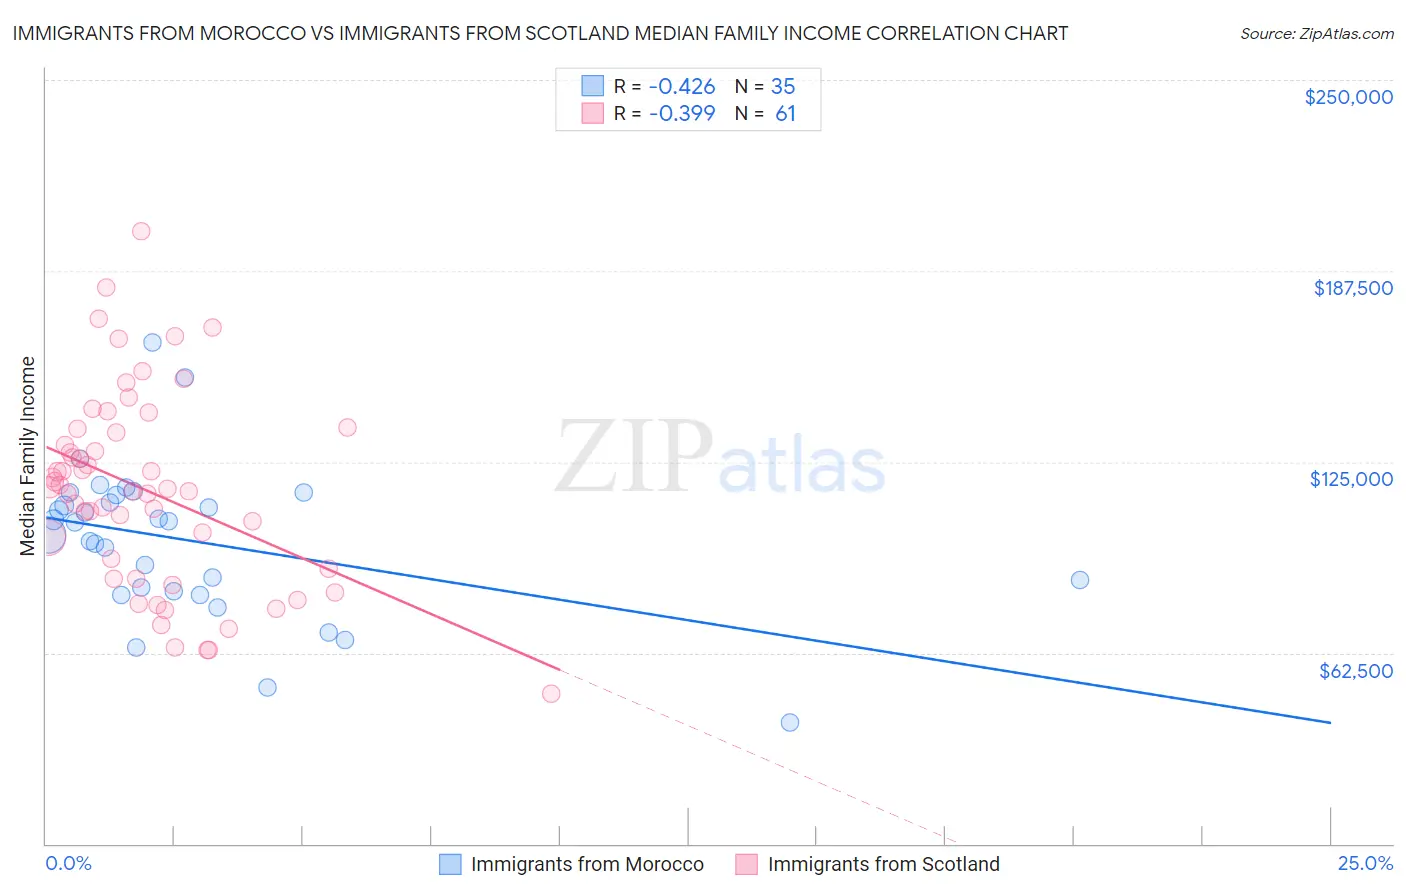
Immigrants from Morocco vs Immigrants from Scotland Median Family Income Correlation Chart
The statistical analysis conducted on geographies consisting of 178,905,802 people shows a moderate negative correlation between the proportion of Immigrants from Morocco and median family income in the United States with a correlation coefficient (R) of -0.426 and weighted average of $105,964. Similarly, the statistical analysis conducted on geographies consisting of 196,366,880 people shows a mild negative correlation between the proportion of Immigrants from Scotland and median family income in the United States with a correlation coefficient (R) of -0.399 and weighted average of $114,392, a difference of 8.0%.
Median Family Income Correlation Summary
| Measurement | Immigrants from Morocco | Immigrants from Scotland |
| Minimum | $39,712 | $48,950 |
| Maximum | $163,880 | $200,376 |
| Range | $124,168 | $151,426 |
| Mean | $99,080 | $115,583 |
| Median | $105,156 | $116,250 |
| Interquartile 25% (IQ1) | $82,830 | $88,375 |
| Interquartile 75% (IQ3) | $114,323 | $135,291 |
| Interquartile Range (IQR) | $31,493 | $46,916 |
| Standard Deviation (Sample) | $24,961 | $31,941 |
| Standard Deviation (Population) | $24,602 | $31,678 |
Similar Demographics by Median Family Income
Demographics Similar to Immigrants from Morocco by Median Family Income
In terms of median family income, the demographic groups most similar to Immigrants from Morocco are Tongan ($105,967, a difference of 0.0%), Slovene ($106,020, a difference of 0.050%), Danish ($105,900, a difference of 0.060%), Czech ($105,839, a difference of 0.12%), and Immigrants from Syria ($106,118, a difference of 0.15%).
| Demographics | Rating | Rank | Median Family Income |
| Immigrants | Uganda | 85.7 /100 | #137 | Excellent $106,188 |
| Immigrants | Vietnam | 85.7 /100 | #138 | Excellent $106,186 |
| Luxembourgers | 85.7 /100 | #139 | Excellent $106,183 |
| Norwegians | 85.5 /100 | #140 | Excellent $106,144 |
| Immigrants | Syria | 85.3 /100 | #141 | Excellent $106,118 |
| Slovenes | 84.7 /100 | #142 | Excellent $106,020 |
| Tongans | 84.3 /100 | #143 | Excellent $105,967 |
| Immigrants | Morocco | 84.3 /100 | #144 | Excellent $105,964 |
| Danes | 83.8 /100 | #145 | Excellent $105,900 |
| Czechs | 83.4 /100 | #146 | Excellent $105,839 |
| Immigrants | Chile | 82.1 /100 | #147 | Excellent $105,655 |
| Hungarians | 81.7 /100 | #148 | Excellent $105,609 |
| Immigrants | Germany | 80.9 /100 | #149 | Excellent $105,507 |
| Irish | 80.5 /100 | #150 | Excellent $105,453 |
| Peruvians | 80.4 /100 | #151 | Excellent $105,444 |
Demographics Similar to Immigrants from Scotland by Median Family Income
In terms of median family income, the demographic groups most similar to Immigrants from Scotland are Immigrants from Pakistan ($114,406, a difference of 0.010%), Mongolian ($114,553, a difference of 0.14%), Immigrants from Belarus ($114,586, a difference of 0.17%), Egyptian ($114,119, a difference of 0.24%), and Paraguayan ($114,016, a difference of 0.33%).
| Demographics | Rating | Rank | Median Family Income |
| Greeks | 99.8 /100 | #57 | Exceptional $115,192 |
| Immigrants | Indonesia | 99.8 /100 | #58 | Exceptional $115,162 |
| Immigrants | Netherlands | 99.8 /100 | #59 | Exceptional $114,987 |
| Immigrants | Latvia | 99.8 /100 | #60 | Exceptional $114,826 |
| Immigrants | Belarus | 99.8 /100 | #61 | Exceptional $114,586 |
| Mongolians | 99.8 /100 | #62 | Exceptional $114,553 |
| Immigrants | Pakistan | 99.8 /100 | #63 | Exceptional $114,406 |
| Immigrants | Scotland | 99.7 /100 | #64 | Exceptional $114,392 |
| Egyptians | 99.7 /100 | #65 | Exceptional $114,119 |
| Paraguayans | 99.7 /100 | #66 | Exceptional $114,016 |
| Immigrants | Spain | 99.7 /100 | #67 | Exceptional $113,815 |
| Immigrants | Serbia | 99.6 /100 | #68 | Exceptional $113,463 |
| Immigrants | Bulgaria | 99.6 /100 | #69 | Exceptional $113,461 |
| Immigrants | Romania | 99.6 /100 | #70 | Exceptional $113,434 |
| South Africans | 99.5 /100 | #71 | Exceptional $113,229 |