Lithuanian vs Immigrants from Scotland Median Family Income

COMPARE

Lithuanian
Race
Ancestry
AfghanAfricanAlaska NativeAlaskan AthabascanAlbanianAleutAlsatianAmericanApacheArabArapahoArgentineanArmenianAssyrian/Chaldean/SyriacAustralianAustrianBahamianBangladeshiBarbadianBasqueBelgianBelizeanBermudanBhutaneseBlackfeetBolivianBrazilianBritishBritish West IndianBulgarianBurmeseCajunCambodianCanadianCape VerdeanCarpatho RusynCelticCentral AmericanCentral American IndianCherokeeCheyenneChickasawChileanChineseChippewaChoctawColombianColvilleComancheCosta RicanCreeCreekCroatianCrowCubanCypriotCzechCzechoslovakianDanishDelawareDominicanDutchDutch West IndianEastern EuropeanEcuadorianEgyptianEnglishEstonianEthiopianEuropeanFijianFilipinoFinnishFrenchFrench American IndianFrench CanadianGermanGerman RussianGhanaianGreekGuamanian/ChamorroGuatemalanGuyaneseHaitianHmongHonduranHopiHoumaHungarianIcelanderIndian (Asian)IndonesianInupiatIranianIraqiIrishIroquoisIsraeliItalianJamaicanJapaneseJordanianKenyanKiowaKoreanLaotianLatvianLebaneseLiberianLithuanianLumbeeLuxembourgerMacedonianMalaysianMalteseMarshalleseMenomineeMexicanMexican American IndianMongolianMoroccanNative HawaiianNavajoNepaleseNew ZealanderNicaraguanNigerianNorthern EuropeanNorwegianOkinawanOsageOttawaPaiutePakistaniPalestinianPanamanianParaguayanPennsylvania GermanPeruvianPimaPolishPortuguesePotawatomiPuebloPuerto RicanPuget Sound SalishRomanianRussianSalvadoranSamoanScandinavianScotch-IrishScottishSeminoleSenegaleseSerbianShoshoneSierra LeoneanSiouxSlavicSlovakSloveneSomaliSouth AfricanSouth AmericanSouth American IndianSoviet UnionSpaniardSpanishSpanish AmericanSpanish American IndianSri LankanSubsaharan AfricanSudaneseSwedishSwissSyrianTaiwaneseThaiTlingit-HaidaTohono O'OdhamTonganTrinidadian and TobagonianTsimshianTurkishU.S. Virgin IslanderUgandanUkrainianUruguayanUteVenezuelanVietnameseWelshWest IndianYakamaYaquiYugoslavianYumanYup'ikZimbabwean
Immigration
NonimmigrantsImmigrantsAfghanistanAfricaAlbaniaArgentinaArmeniaAsiaAustraliaAustriaBahamasBangladeshBarbadosBelarusBelgiumBelizeBoliviaBosnia and HerzegovinaBrazilBulgariaBurma/MyanmarCabo VerdeCambodiaCameroonCanadaCaribbeanCentral AmericaChileChinaColombiaCongoCosta RicaCroatiaCubaCzechoslovakiaDenmarkDominicaDominican RepublicEastern AfricaEastern AsiaEastern EuropeEcuadorEgyptEl SalvadorEnglandEritreaEthiopiaEuropeFijiFranceGermanyGhanaGreeceGrenadaGuatemalaGuyanaHaitiHondurasHong KongHungaryIndiaIndonesiaIranIraqIrelandIsraelItalyJamaicaJapanJordanKazakhstanKenyaKoreaKuwaitLaosLatin AmericaLatviaLebanonLiberiaLithuaniaMalaysiaMexicoMicronesiaMiddle AfricaMoldovaMoroccoNepalNetherlandsNicaraguaNigeriaNorth AmericaNorth MacedoniaNorthern AfricaNorthern EuropeNorwayOceaniaPakistanPanamaPeruPhilippinesPolandPortugalRomaniaRussiaSaudi ArabiaSenegalSerbiaSierra LeoneSingaporeSomaliaSouth AfricaSouth AmericaSouth Central AsiaSouth Eastern AsiaSouthern EuropeSpainSri LankaSt. Vincent and the GrenadinesSudanSwedenSwitzerlandSyriaTaiwanThailandTrinidad and TobagoTurkeyUgandaUkraineUruguayUzbekistanVenezuelaVietnamWest IndiesWestern AfricaWestern AsiaWestern EuropeYemenZaireZimbabweAzores
Immigrants from Scotland
Race
Ancestry
AfghanAfricanAlaska NativeAlaskan AthabascanAlbanianAleutAlsatianAmericanApacheArabArapahoArgentineanArmenianAssyrian/Chaldean/SyriacAustralianAustrianBahamianBangladeshiBarbadianBasqueBelgianBelizeanBermudanBhutaneseBlackfeetBolivianBrazilianBritishBritish West IndianBulgarianBurmeseCajunCambodianCanadianCape VerdeanCarpatho RusynCelticCentral AmericanCentral American IndianCherokeeCheyenneChickasawChileanChineseChippewaChoctawColombianColvilleComancheCosta RicanCreeCreekCroatianCrowCubanCypriotCzechCzechoslovakianDanishDelawareDominicanDutchDutch West IndianEastern EuropeanEcuadorianEgyptianEnglishEstonianEthiopianEuropeanFijianFilipinoFinnishFrenchFrench American IndianFrench CanadianGermanGerman RussianGhanaianGreekGuamanian/ChamorroGuatemalanGuyaneseHaitianHmongHonduranHopiHoumaHungarianIcelanderIndian (Asian)IndonesianInupiatIranianIraqiIrishIroquoisIsraeliItalianJamaicanJapaneseJordanianKenyanKiowaKoreanLaotianLatvianLebaneseLiberianLumbeeLuxembourgerMacedonianMalaysianMalteseMarshalleseMenomineeMexicanMexican American IndianMongolianMoroccanNative HawaiianNavajoNepaleseNew ZealanderNicaraguanNigerianNorthern EuropeanNorwegianOkinawanOsageOttawaPaiutePakistaniPalestinianPanamanianParaguayanPennsylvania GermanPeruvianPimaPolishPortuguesePotawatomiPuebloPuerto RicanPuget Sound SalishRomanianRussianSalvadoranSamoanScandinavianScotch-IrishScottishSeminoleSenegaleseSerbianShoshoneSierra LeoneanSiouxSlavicSlovakSloveneSomaliSouth AfricanSouth AmericanSouth American IndianSoviet UnionSpaniardSpanishSpanish AmericanSpanish American IndianSri LankanSubsaharan AfricanSudaneseSwedishSwissSyrianTaiwaneseThaiTlingit-HaidaTohono O'OdhamTonganTrinidadian and TobagonianTsimshianTurkishU.S. Virgin IslanderUgandanUkrainianUruguayanUteVenezuelanVietnameseWelshWest IndianYakamaYaquiYugoslavianYumanYup'ikZimbabwean
Immigration
NonimmigrantsImmigrantsAfghanistanAfricaAlbaniaArgentinaArmeniaAsiaAustraliaAustriaBahamasBangladeshBarbadosBelarusBelgiumBelizeBoliviaBosnia and HerzegovinaBrazilBulgariaBurma/MyanmarCabo VerdeCambodiaCameroonCanadaCaribbeanCentral AmericaChileChinaColombiaCongoCosta RicaCroatiaCubaCzechoslovakiaDenmarkDominicaDominican RepublicEastern AfricaEastern AsiaEastern EuropeEcuadorEgyptEl SalvadorEnglandEritreaEthiopiaEuropeFijiFranceGermanyGhanaGreeceGrenadaGuatemalaGuyanaHaitiHondurasHong KongHungaryIndiaIndonesiaIranIraqIrelandIsraelItalyJamaicaJapanJordanKazakhstanKenyaKoreaKuwaitLaosLatin AmericaLatviaLebanonLiberiaLithuaniaMalaysiaMexicoMicronesiaMiddle AfricaMoldovaMoroccoNepalNetherlandsNicaraguaNigeriaNorth AmericaNorth MacedoniaNorthern AfricaNorthern EuropeNorwayOceaniaPakistanPanamaPeruPhilippinesPolandPortugalRomaniaRussiaSaudi ArabiaScotlandSenegalSerbiaSierra LeoneSingaporeSomaliaSouth AfricaSouth AmericaSouth Central AsiaSouth Eastern AsiaSouthern EuropeSpainSri LankaSt. Vincent and the GrenadinesSudanSwedenSwitzerlandSyriaTaiwanThailandTrinidad and TobagoTurkeyUgandaUkraineUruguayUzbekistanVenezuelaVietnamWest IndiesWestern AfricaWestern AsiaWestern EuropeYemenZaireZimbabweAzores
Median Family Income
Income
Poverty
Unemployment
Labor Participation
Family Structure
Vehicle Availability
Education Level
Disability

Median Family Income Comparison

Lithuanians

Immigrants from Scotland

Exceptional
Exceptional
$115,395
MEDIAN FAMILY INCOME
99.8/ 100
METRIC RATING
55th/ 347
METRIC RANK
$114,392
MEDIAN FAMILY INCOME
99.7/ 100
METRIC RATING
64th/ 347
METRIC RANK

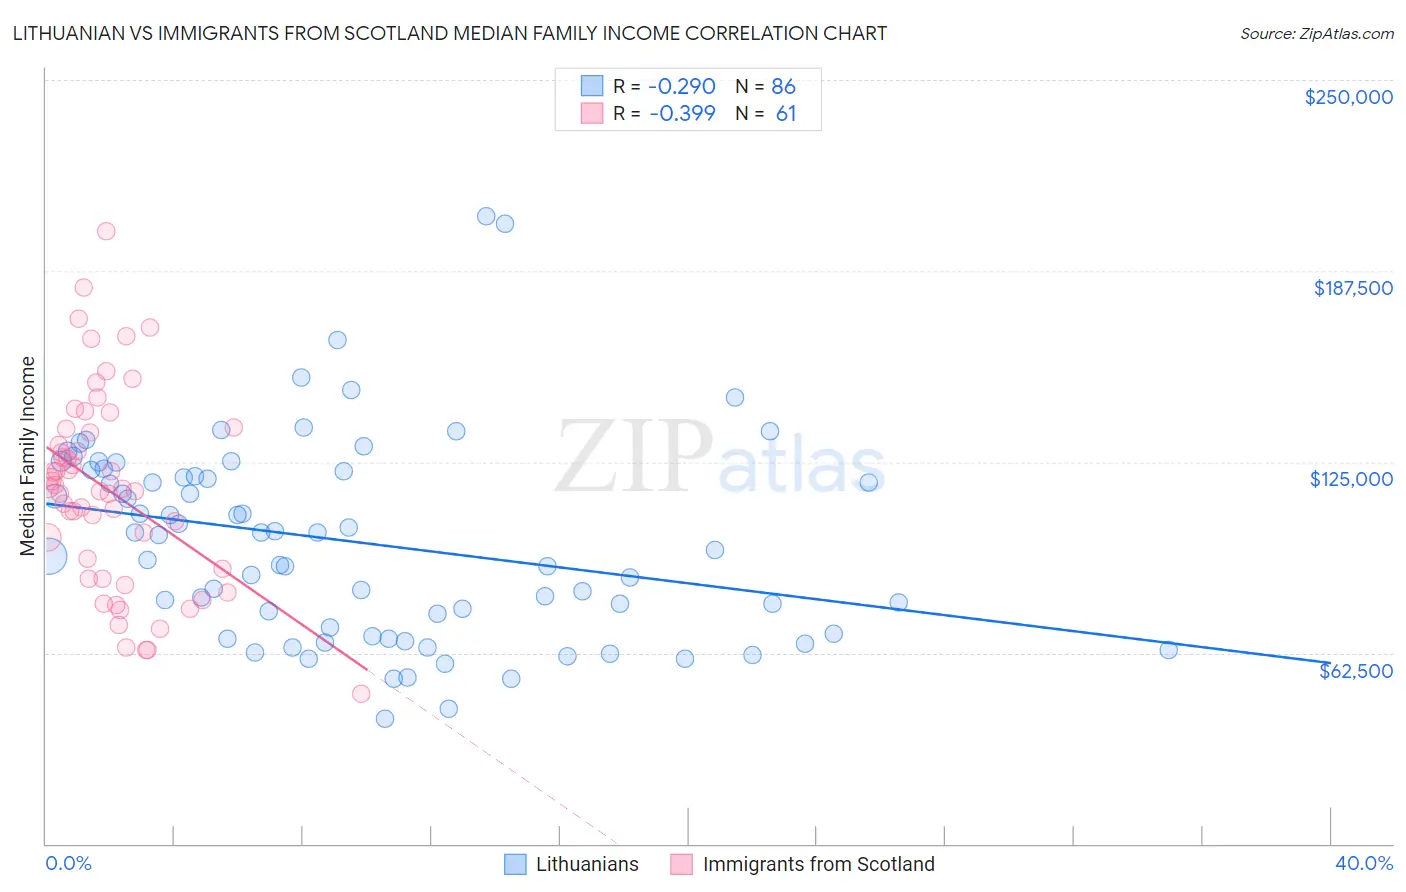
Lithuanian vs Immigrants from Scotland Median Family Income Correlation Chart

The statistical analysis conducted on geographies consisting of 421,580,466 people shows a weak negative correlation between the proportion of Lithuanians and median family income in the United States with a correlation coefficient (R) of -0.290 and weighted average of $115,395. Similarly, the statistical analysis conducted on geographies consisting of 196,366,880 people shows a mild negative correlation between the proportion of Immigrants from Scotland and median family income in the United States with a correlation coefficient (R) of -0.399 and weighted average of $114,392, a difference of 0.88%.
Lithuanian vs Immigrants from Scotland Median Family Income

Median Family Income Correlation Summary

MeasurementLithuanianImmigrants from Scotland
Minimum$40,809$48,950
Maximum$205,368$200,376
Range$164,559$151,426
Mean$98,726$115,583
Median$98,683$116,250
Interquartile 25% (IQ1)$68,538$88,375
Interquartile 75% (IQ3)$122,072$135,291
Interquartile Range (IQR)$53,534$46,916
Standard Deviation (Sample)$32,784$31,941
Standard Deviation (Population)$32,593$31,678

Demographics Similar to Lithuanians and Immigrants from Scotland by Median Family Income

In terms of median family income, the demographic groups most similar to Lithuanians are Immigrants from Europe ($115,523, a difference of 0.11%), New Zealander ($115,230, a difference of 0.14%), Greek ($115,192, a difference of 0.18%), Immigrants from Indonesia ($115,162, a difference of 0.20%), and Immigrants from Netherlands ($114,987, a difference of 0.35%). Similarly, the demographic groups most similar to Immigrants from Scotland are Immigrants from Pakistan ($114,406, a difference of 0.010%), Mongolian ($114,553, a difference of 0.14%), Immigrants from Belarus ($114,586, a difference of 0.17%), Egyptian ($114,119, a difference of 0.24%), and Paraguayan ($114,016, a difference of 0.33%).
DemographicsRating | RankMedian Family Income
Chinese
99.9
/100
|
#49
Exceptional
$116,188
Immigrants | Czechoslovakia
99.9
/100
|
#50
Exceptional
$116,165
Immigrants | Malaysia
99.9
/100
|
#51
Exceptional
$115,880
Maltese
99.9
/100
|
#52
Exceptional
$115,862
Immigrants | Norway
99.9
/100
|
#53
Exceptional
$115,847
Immigrants | Europe
99.9
/100
|
#54
Exceptional
$115,523
Lithuanians
99.8
/100
|
#55
Exceptional
$115,395
New Zealanders
99.8
/100
|
#56
Exceptional
$115,230
Greeks
99.8
/100
|
#57
Exceptional
$115,192
Immigrants | Indonesia
99.8
/100
|
#58
Exceptional
$115,162
Immigrants | Netherlands
99.8
/100
|
#59
Exceptional
$114,987
Immigrants | Latvia
99.8
/100
|
#60
Exceptional
$114,826
Immigrants | Belarus
99.8
/100
|
#61
Exceptional
$114,586
Mongolians
99.8
/100
|
#62
Exceptional
$114,553
Immigrants | Pakistan
99.8
/100
|
#63
Exceptional
$114,406
Immigrants | Scotland
99.7
/100
|
#64
Exceptional
$114,392
Egyptians
99.7
/100
|
#65
Exceptional
$114,119
Paraguayans
99.7
/100
|
#66
Exceptional
$114,016
Immigrants | Spain
99.7
/100
|
#67
Exceptional
$113,815
Immigrants | Serbia
99.6
/100
|
#68
Exceptional
$113,463
Immigrants | Bulgaria
99.6
/100
|
#69
Exceptional
$113,461