Basque vs Immigrants from Ireland Median Family Income
COMPARE
Basque
Immigrants from Ireland
Median Family Income
Median Family Income Comparison
Basques
Immigrants from Ireland
$104,760
MEDIAN FAMILY INCOME
74.4/ 100
METRIC RATING
156th/ 347
METRIC RANK
$127,584
MEDIAN FAMILY INCOME
100.0/ 100
METRIC RATING
10th/ 347
METRIC RANK
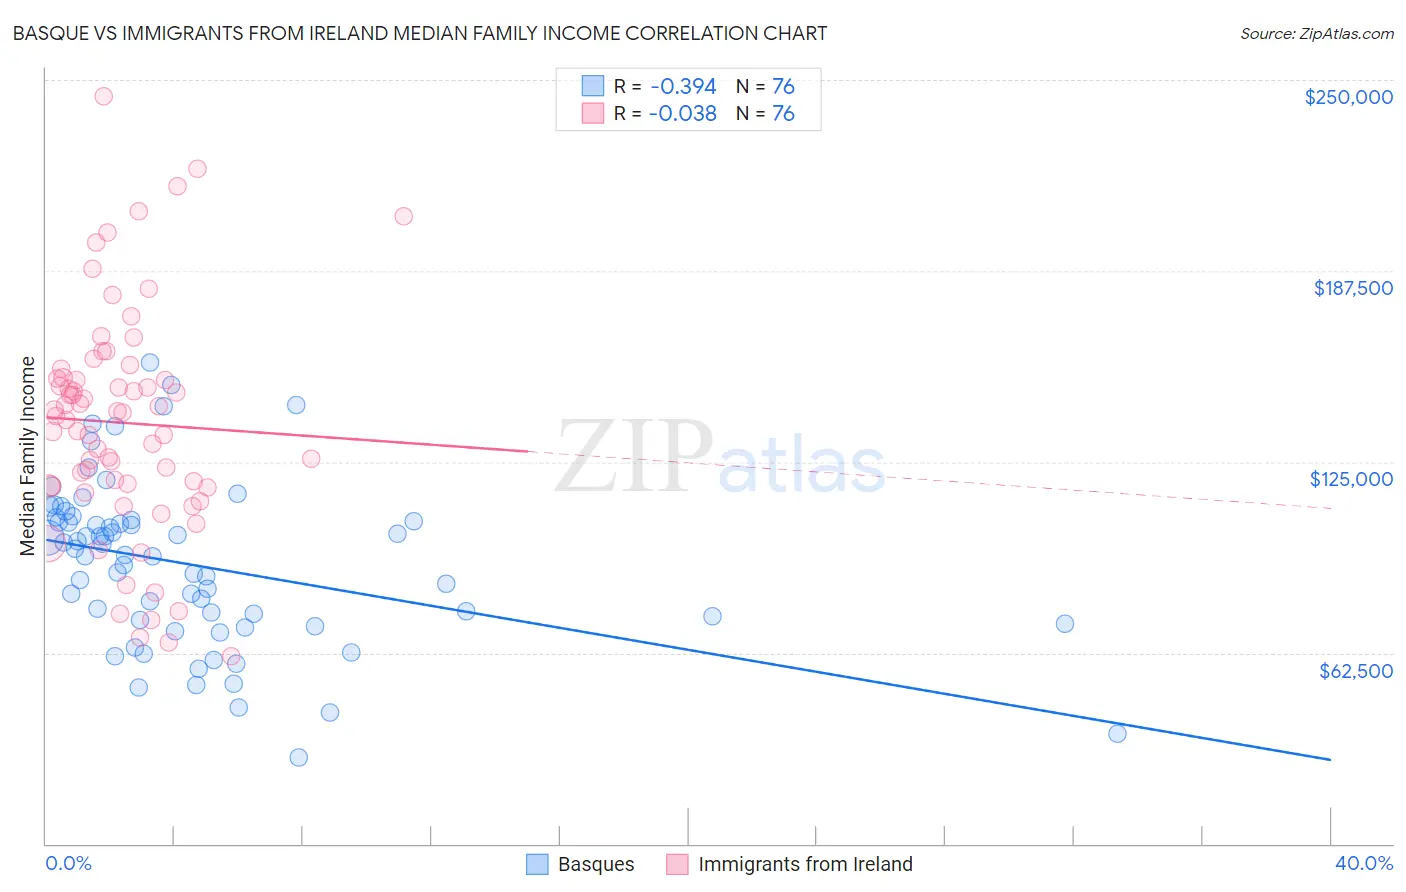
Basque vs Immigrants from Ireland Median Family Income Correlation Chart
The statistical analysis conducted on geographies consisting of 165,742,125 people shows a mild negative correlation between the proportion of Basques and median family income in the United States with a correlation coefficient (R) of -0.394 and weighted average of $104,760. Similarly, the statistical analysis conducted on geographies consisting of 240,734,590 people shows no correlation between the proportion of Immigrants from Ireland and median family income in the United States with a correlation coefficient (R) of -0.038 and weighted average of $127,584, a difference of 21.8%.
Median Family Income Correlation Summary
| Measurement | Basque | Immigrants from Ireland |
| Minimum | $28,036 | $61,250 |
| Maximum | $157,351 | $244,785 |
| Range | $129,315 | $183,535 |
| Mean | $91,256 | $137,790 |
| Median | $94,457 | $140,594 |
| Interquartile 25% (IQ1) | $72,725 | $117,130 |
| Interquartile 75% (IQ3) | $105,919 | $152,367 |
| Interquartile Range (IQR) | $33,194 | $35,237 |
| Standard Deviation (Sample) | $26,783 | $36,818 |
| Standard Deviation (Population) | $26,606 | $36,575 |
Similar Demographics by Median Family Income
Demographics Similar to Basques by Median Family Income
In terms of median family income, the demographic groups most similar to Basques are Native Hawaiian ($104,910, a difference of 0.14%), Immigrants from Nepal ($104,966, a difference of 0.20%), Moroccan ($104,488, a difference of 0.26%), Scandinavian ($104,410, a difference of 0.34%), and Swiss ($104,396, a difference of 0.35%).
| Demographics | Rating | Rank | Median Family Income |
| Immigrants | Germany | 80.9 /100 | #149 | Excellent $105,507 |
| Irish | 80.5 /100 | #150 | Excellent $105,453 |
| Peruvians | 80.4 /100 | #151 | Excellent $105,444 |
| Immigrants | Albania | 79.1 /100 | #152 | Good $105,285 |
| Slavs | 77.9 /100 | #153 | Good $105,144 |
| Immigrants | Nepal | 76.3 /100 | #154 | Good $104,966 |
| Native Hawaiians | 75.8 /100 | #155 | Good $104,910 |
| Basques | 74.4 /100 | #156 | Good $104,760 |
| Moroccans | 71.6 /100 | #157 | Good $104,488 |
| Scandinavians | 70.8 /100 | #158 | Good $104,410 |
| Swiss | 70.7 /100 | #159 | Good $104,396 |
| Scottish | 69.5 /100 | #160 | Good $104,288 |
| Icelanders | 69.4 /100 | #161 | Good $104,282 |
| Immigrants | Sierra Leone | 66.2 /100 | #162 | Good $103,990 |
| Costa Ricans | 66.2 /100 | #163 | Good $103,989 |
Demographics Similar to Immigrants from Ireland by Median Family Income
In terms of median family income, the demographic groups most similar to Immigrants from Ireland are Immigrants from Israel ($127,430, a difference of 0.12%), Cypriot ($127,064, a difference of 0.41%), Immigrants from Australia ($126,620, a difference of 0.76%), Immigrants from South Central Asia ($125,956, a difference of 1.3%), and Eastern European ($125,546, a difference of 1.6%).
| Demographics | Rating | Rank | Median Family Income |
| Immigrants | Singapore | 100.0 /100 | #3 | Exceptional $134,818 |
| Immigrants | India | 100.0 /100 | #4 | Exceptional $134,028 |
| Iranians | 100.0 /100 | #5 | Exceptional $133,839 |
| Thais | 100.0 /100 | #6 | Exceptional $131,281 |
| Immigrants | Hong Kong | 100.0 /100 | #7 | Exceptional $131,067 |
| Immigrants | Iran | 100.0 /100 | #8 | Exceptional $130,894 |
| Okinawans | 100.0 /100 | #9 | Exceptional $129,979 |
| Immigrants | Ireland | 100.0 /100 | #10 | Exceptional $127,584 |
| Immigrants | Israel | 100.0 /100 | #11 | Exceptional $127,430 |
| Cypriots | 100.0 /100 | #12 | Exceptional $127,064 |
| Immigrants | Australia | 100.0 /100 | #13 | Exceptional $126,620 |
| Immigrants | South Central Asia | 100.0 /100 | #14 | Exceptional $125,956 |
| Eastern Europeans | 100.0 /100 | #15 | Exceptional $125,546 |
| Immigrants | China | 100.0 /100 | #16 | Exceptional $125,540 |
| Indians (Asian) | 100.0 /100 | #17 | Exceptional $125,312 |