Immigrants from Cameroon vs Colombian Median Family Income
COMPARE
Immigrants from Cameroon
Colombian
Median Family Income
Median Family Income Comparison
Immigrants from Cameroon
Colombians
$100,289
MEDIAN FAMILY INCOME
22.8/ 100
METRIC RATING
197th/ 347
METRIC RANK
$100,750
MEDIAN FAMILY INCOME
27.2/ 100
METRIC RATING
191st/ 347
METRIC RANK
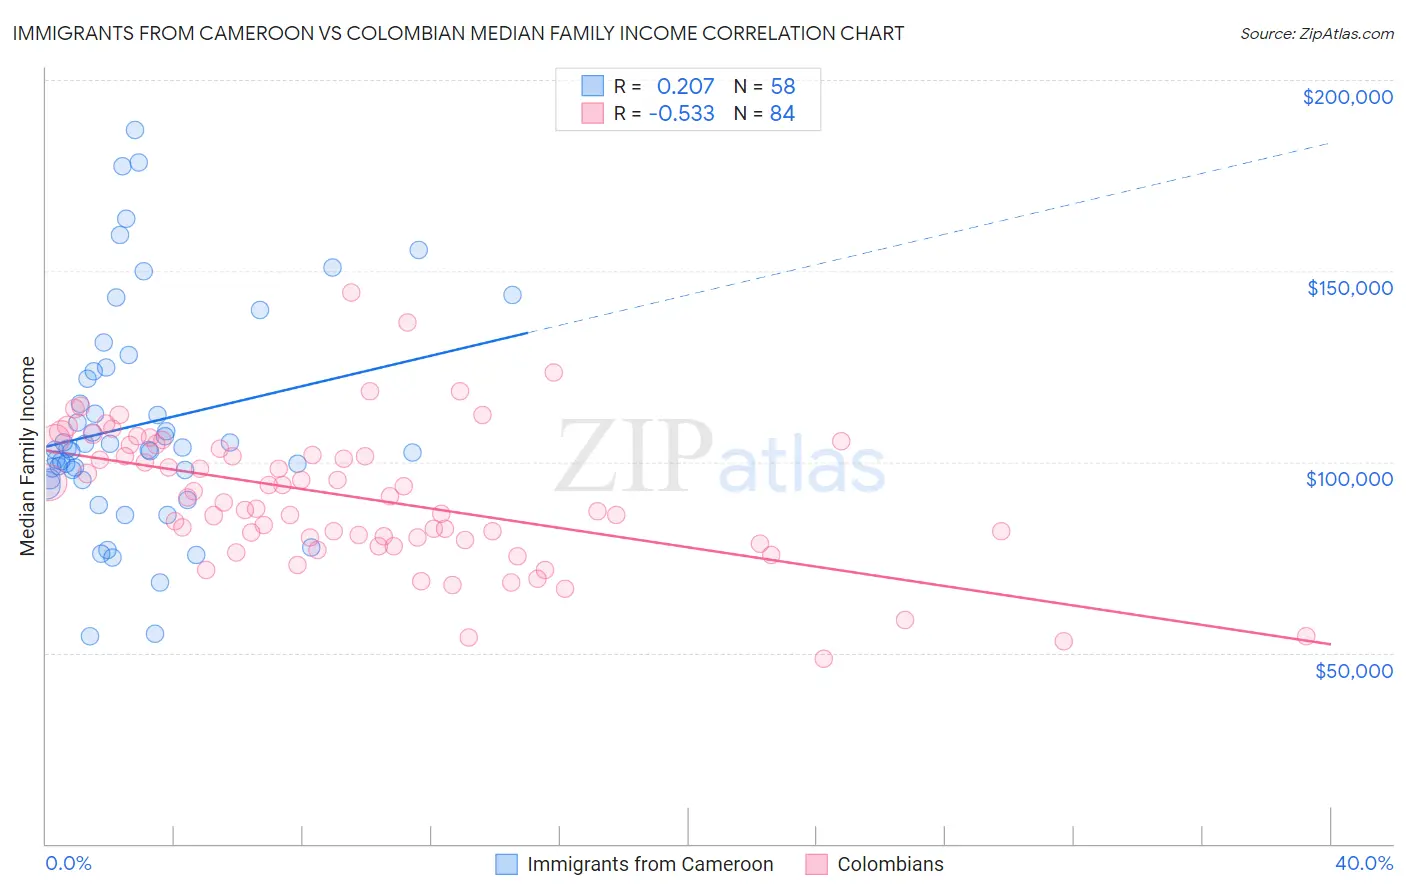
Immigrants from Cameroon vs Colombian Median Family Income Correlation Chart
The statistical analysis conducted on geographies consisting of 130,726,829 people shows a weak positive correlation between the proportion of Immigrants from Cameroon and median family income in the United States with a correlation coefficient (R) of 0.207 and weighted average of $100,289. Similarly, the statistical analysis conducted on geographies consisting of 419,162,834 people shows a substantial negative correlation between the proportion of Colombians and median family income in the United States with a correlation coefficient (R) of -0.533 and weighted average of $100,750, a difference of 0.46%.
Median Family Income Correlation Summary
| Measurement | Immigrants from Cameroon | Colombian |
| Minimum | $54,178 | $48,304 |
| Maximum | $186,802 | $144,224 |
| Range | $132,624 | $95,920 |
| Mean | $109,949 | $90,772 |
| Median | $103,317 | $90,051 |
| Interquartile 25% (IQ1) | $95,592 | $79,908 |
| Interquartile 75% (IQ3) | $123,784 | $103,968 |
| Interquartile Range (IQR) | $28,192 | $24,060 |
| Standard Deviation (Sample) | $29,032 | $18,065 |
| Standard Deviation (Population) | $28,780 | $17,957 |
Demographics Similar to Immigrants from Cameroon and Colombians by Median Family Income
In terms of median family income, the demographic groups most similar to Immigrants from Cameroon are Immigrants from Africa ($100,256, a difference of 0.030%), Samoan ($100,344, a difference of 0.060%), Immigrants from South America ($100,414, a difference of 0.12%), Yugoslavian ($100,119, a difference of 0.17%), and Spanish ($99,977, a difference of 0.31%). Similarly, the demographic groups most similar to Colombians are Immigrants from Kenya ($100,679, a difference of 0.070%), Iraqi ($100,658, a difference of 0.090%), Uruguayan ($100,656, a difference of 0.090%), Immigrants ($100,962, a difference of 0.21%), and Immigrants from Portugal ($100,984, a difference of 0.23%).
| Demographics | Rating | Rank | Median Family Income |
| Immigrants | Costa Rica | 33.7 /100 | #184 | Fair $101,354 |
| Dutch | 31.9 /100 | #185 | Fair $101,192 |
| Celtics | 31.3 /100 | #186 | Fair $101,139 |
| Tlingit-Haida | 30.8 /100 | #187 | Fair $101,092 |
| Guamanians/Chamorros | 30.5 /100 | #188 | Fair $101,061 |
| Immigrants | Portugal | 29.6 /100 | #189 | Fair $100,984 |
| Immigrants | Immigrants | 29.4 /100 | #190 | Fair $100,962 |
| Colombians | 27.2 /100 | #191 | Fair $100,750 |
| Immigrants | Kenya | 26.5 /100 | #192 | Fair $100,679 |
| Iraqis | 26.3 /100 | #193 | Fair $100,658 |
| Uruguayans | 26.3 /100 | #194 | Fair $100,656 |
| Immigrants | South America | 23.9 /100 | #195 | Fair $100,414 |
| Samoans | 23.3 /100 | #196 | Fair $100,344 |
| Immigrants | Cameroon | 22.8 /100 | #197 | Fair $100,289 |
| Immigrants | Africa | 22.5 /100 | #198 | Fair $100,256 |
| Yugoslavians | 21.3 /100 | #199 | Fair $100,119 |
| Spanish | 20.1 /100 | #200 | Fair $99,977 |
| Immigrants | Thailand | 19.0 /100 | #201 | Poor $99,840 |
| Whites/Caucasians | 18.7 /100 | #202 | Poor $99,800 |
| Scotch-Irish | 17.1 /100 | #203 | Poor $99,591 |
| Ghanaians | 12.6 /100 | #204 | Poor $98,877 |