Alaska Native vs Cape Verdean Median Female Earnings
COMPARE
Alaska Native
Cape Verdean
Median Female Earnings
Median Female Earnings Comparison
Alaska Natives
Cape Verdeans
$38,202
MEDIAN FEMALE EARNINGS
4.3/ 100
METRIC RATING
238th/ 347
METRIC RANK
$38,614
MEDIAN FEMALE EARNINGS
9.5/ 100
METRIC RATING
218th/ 347
METRIC RANK
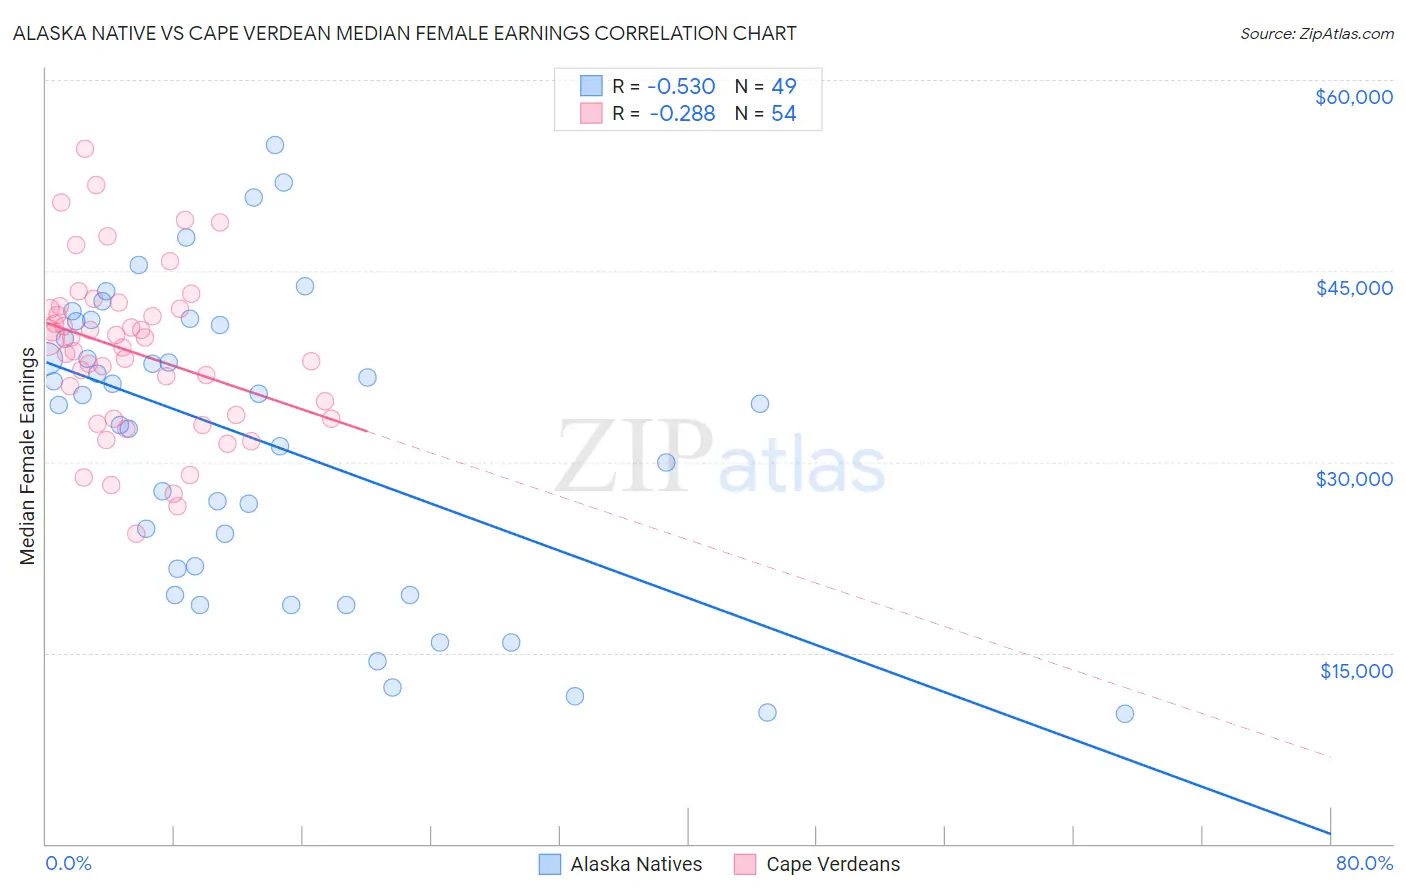
Alaska Native vs Cape Verdean Median Female Earnings Correlation Chart
The statistical analysis conducted on geographies consisting of 76,744,414 people shows a substantial negative correlation between the proportion of Alaska Natives and median female earnings in the United States with a correlation coefficient (R) of -0.530 and weighted average of $38,202. Similarly, the statistical analysis conducted on geographies consisting of 107,559,338 people shows a weak negative correlation between the proportion of Cape Verdeans and median female earnings in the United States with a correlation coefficient (R) of -0.288 and weighted average of $38,614, a difference of 1.1%.
Median Female Earnings Correlation Summary
| Measurement | Alaska Native | Cape Verdean |
| Minimum | $10,250 | $24,340 |
| Maximum | $54,922 | $54,554 |
| Range | $44,672 | $30,214 |
| Mean | $31,635 | $38,613 |
| Median | $34,583 | $39,359 |
| Interquartile 25% (IQ1) | $20,573 | $33,431 |
| Interquartile 75% (IQ3) | $40,922 | $42,075 |
| Interquartile Range (IQR) | $20,349 | $8,644 |
| Standard Deviation (Sample) | $11,761 | $6,549 |
| Standard Deviation (Population) | $11,640 | $6,488 |
Demographics Similar to Alaska Natives and Cape Verdeans by Median Female Earnings
In terms of median female earnings, the demographic groups most similar to Alaska Natives are Immigrants from Cabo Verde ($38,208, a difference of 0.020%), Liberian ($38,215, a difference of 0.030%), Sudanese ($38,215, a difference of 0.040%), Celtic ($38,283, a difference of 0.21%), and Tongan ($38,288, a difference of 0.22%). Similarly, the demographic groups most similar to Cape Verdeans are Nepalese ($38,603, a difference of 0.030%), Yugoslavian ($38,573, a difference of 0.11%), Immigrants from the Azores ($38,573, a difference of 0.11%), Japanese ($38,528, a difference of 0.22%), and Immigrants from Sudan ($38,511, a difference of 0.27%).
| Demographics | Rating | Rank | Median Female Earnings |
| Cape Verdeans | 9.5 /100 | #218 | Tragic $38,614 |
| Nepalese | 9.3 /100 | #219 | Tragic $38,603 |
| Yugoslavians | 8.8 /100 | #220 | Tragic $38,573 |
| Immigrants | Azores | 8.8 /100 | #221 | Tragic $38,573 |
| Japanese | 8.1 /100 | #222 | Tragic $38,528 |
| Immigrants | Sudan | 7.8 /100 | #223 | Tragic $38,511 |
| Native Hawaiians | 7.1 /100 | #224 | Tragic $38,461 |
| French | 7.0 /100 | #225 | Tragic $38,457 |
| French Canadians | 6.8 /100 | #226 | Tragic $38,436 |
| Scottish | 6.3 /100 | #227 | Tragic $38,397 |
| Sub-Saharan Africans | 6.2 /100 | #228 | Tragic $38,391 |
| Belgians | 6.1 /100 | #229 | Tragic $38,382 |
| Basques | 5.7 /100 | #230 | Tragic $38,352 |
| Somalis | 5.5 /100 | #231 | Tragic $38,333 |
| Scandinavians | 5.2 /100 | #232 | Tragic $38,306 |
| Tongans | 5.1 /100 | #233 | Tragic $38,288 |
| Celtics | 5.0 /100 | #234 | Tragic $38,283 |
| Sudanese | 4.4 /100 | #235 | Tragic $38,215 |
| Liberians | 4.4 /100 | #236 | Tragic $38,215 |
| Immigrants | Cabo Verde | 4.3 /100 | #237 | Tragic $38,208 |
| Alaska Natives | 4.3 /100 | #238 | Tragic $38,202 |