Ecuadorian vs Cape Verdean Median Female Earnings
COMPARE
Ecuadorian
Cape Verdean
Median Female Earnings
Median Female Earnings Comparison
Ecuadorians
Cape Verdeans
$39,117
MEDIAN FEMALE EARNINGS
23.0/ 100
METRIC RATING
198th/ 347
METRIC RANK
$38,614
MEDIAN FEMALE EARNINGS
9.5/ 100
METRIC RATING
218th/ 347
METRIC RANK
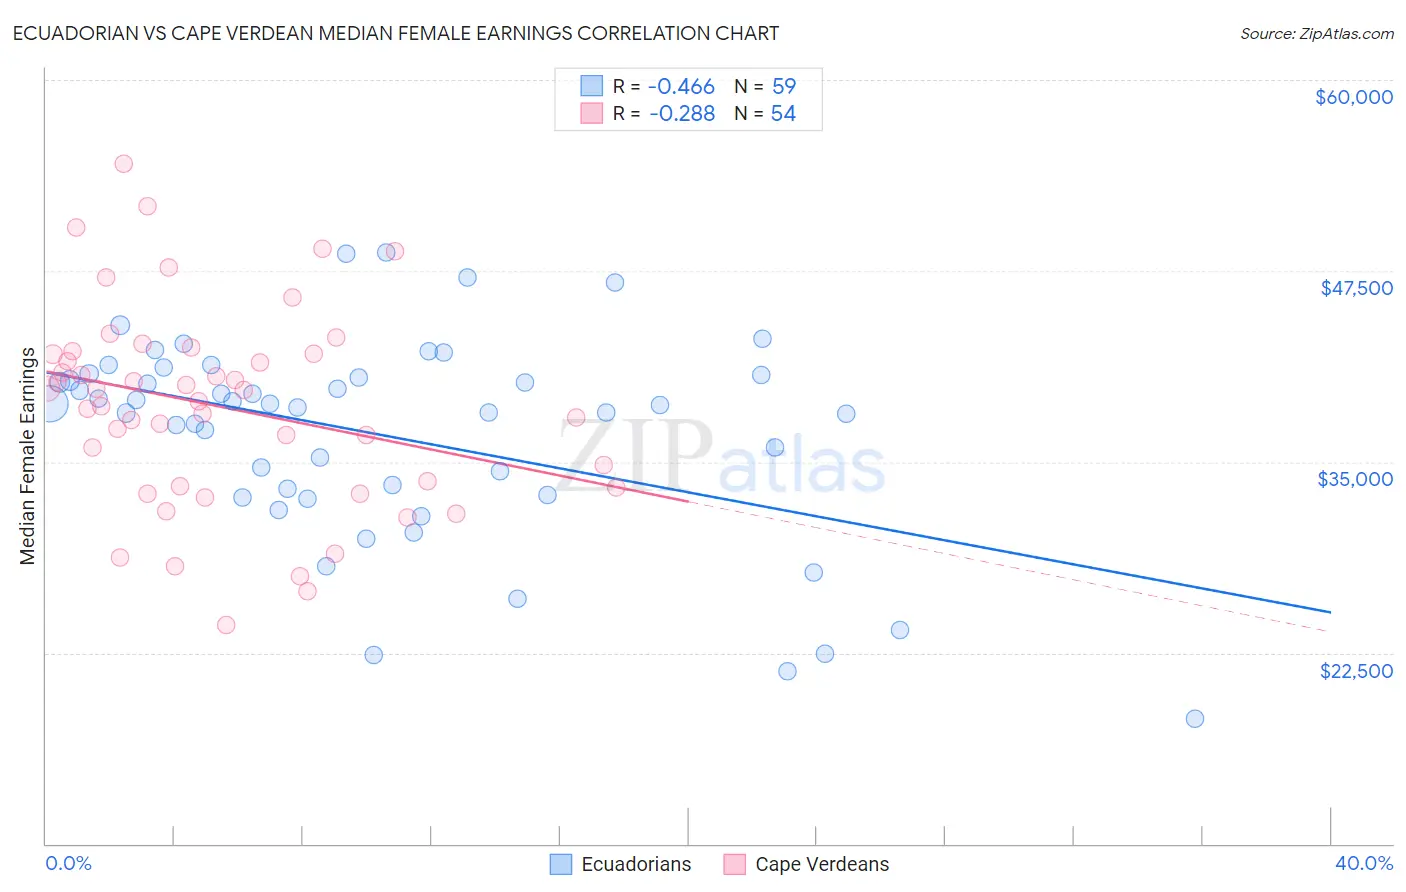
Ecuadorian vs Cape Verdean Median Female Earnings Correlation Chart
The statistical analysis conducted on geographies consisting of 317,768,911 people shows a moderate negative correlation between the proportion of Ecuadorians and median female earnings in the United States with a correlation coefficient (R) of -0.466 and weighted average of $39,117. Similarly, the statistical analysis conducted on geographies consisting of 107,559,338 people shows a weak negative correlation between the proportion of Cape Verdeans and median female earnings in the United States with a correlation coefficient (R) of -0.288 and weighted average of $38,614, a difference of 1.3%.
Median Female Earnings Correlation Summary
| Measurement | Ecuadorian | Cape Verdean |
| Minimum | $18,150 | $24,340 |
| Maximum | $48,689 | $54,554 |
| Range | $30,539 | $30,214 |
| Mean | $36,751 | $38,613 |
| Median | $38,737 | $39,359 |
| Interquartile 25% (IQ1) | $32,822 | $33,431 |
| Interquartile 75% (IQ3) | $40,668 | $42,075 |
| Interquartile Range (IQR) | $7,846 | $8,644 |
| Standard Deviation (Sample) | $6,680 | $6,549 |
| Standard Deviation (Population) | $6,623 | $6,488 |
Demographics Similar to Ecuadorians and Cape Verdeans by Median Female Earnings
In terms of median female earnings, the demographic groups most similar to Ecuadorians are Icelander ($39,109, a difference of 0.020%), Immigrants from Panama ($39,049, a difference of 0.17%), Panamanian ($39,049, a difference of 0.17%), Slovak ($39,029, a difference of 0.23%), and Czech ($38,992, a difference of 0.32%). Similarly, the demographic groups most similar to Cape Verdeans are Immigrants from Jamaica ($38,625, a difference of 0.030%), Immigrants from Ecuador ($38,644, a difference of 0.080%), Spaniard ($38,656, a difference of 0.11%), Iraqi ($38,666, a difference of 0.13%), and Jamaican ($38,670, a difference of 0.14%).
| Demographics | Rating | Rank | Median Female Earnings |
| Ecuadorians | 23.0 /100 | #198 | Fair $39,117 |
| Icelanders | 22.7 /100 | #199 | Fair $39,109 |
| Immigrants | Panama | 20.6 /100 | #200 | Fair $39,049 |
| Panamanians | 20.6 /100 | #201 | Fair $39,049 |
| Slovaks | 19.9 /100 | #202 | Poor $39,029 |
| Czechs | 18.7 /100 | #203 | Poor $38,992 |
| Immigrants | Uruguay | 17.3 /100 | #204 | Poor $38,945 |
| Immigrants | Colombia | 16.3 /100 | #205 | Poor $38,913 |
| Immigrants | Bosnia and Herzegovina | 15.6 /100 | #206 | Poor $38,886 |
| Immigrants | Cambodia | 14.2 /100 | #207 | Poor $38,833 |
| Immigrants | Thailand | 13.6 /100 | #208 | Poor $38,810 |
| Norwegians | 13.4 /100 | #209 | Poor $38,802 |
| Czechoslovakians | 12.0 /100 | #210 | Poor $38,738 |
| Aleuts | 11.6 /100 | #211 | Poor $38,719 |
| Guamanians/Chamorros | 11.5 /100 | #212 | Poor $38,717 |
| Jamaicans | 10.5 /100 | #213 | Poor $38,670 |
| Iraqis | 10.5 /100 | #214 | Poor $38,666 |
| Spaniards | 10.3 /100 | #215 | Poor $38,656 |
| Immigrants | Ecuador | 10.1 /100 | #216 | Poor $38,644 |
| Immigrants | Jamaica | 9.7 /100 | #217 | Tragic $38,625 |
| Cape Verdeans | 9.5 /100 | #218 | Tragic $38,614 |