New Zealander vs Cape Verdean Median Female Earnings
COMPARE
New Zealander
Cape Verdean
Median Female Earnings
Median Female Earnings Comparison
New Zealanders
Cape Verdeans
$42,446
MEDIAN FEMALE EARNINGS
99.7/ 100
METRIC RATING
75th/ 347
METRIC RANK
$38,614
MEDIAN FEMALE EARNINGS
9.5/ 100
METRIC RATING
218th/ 347
METRIC RANK
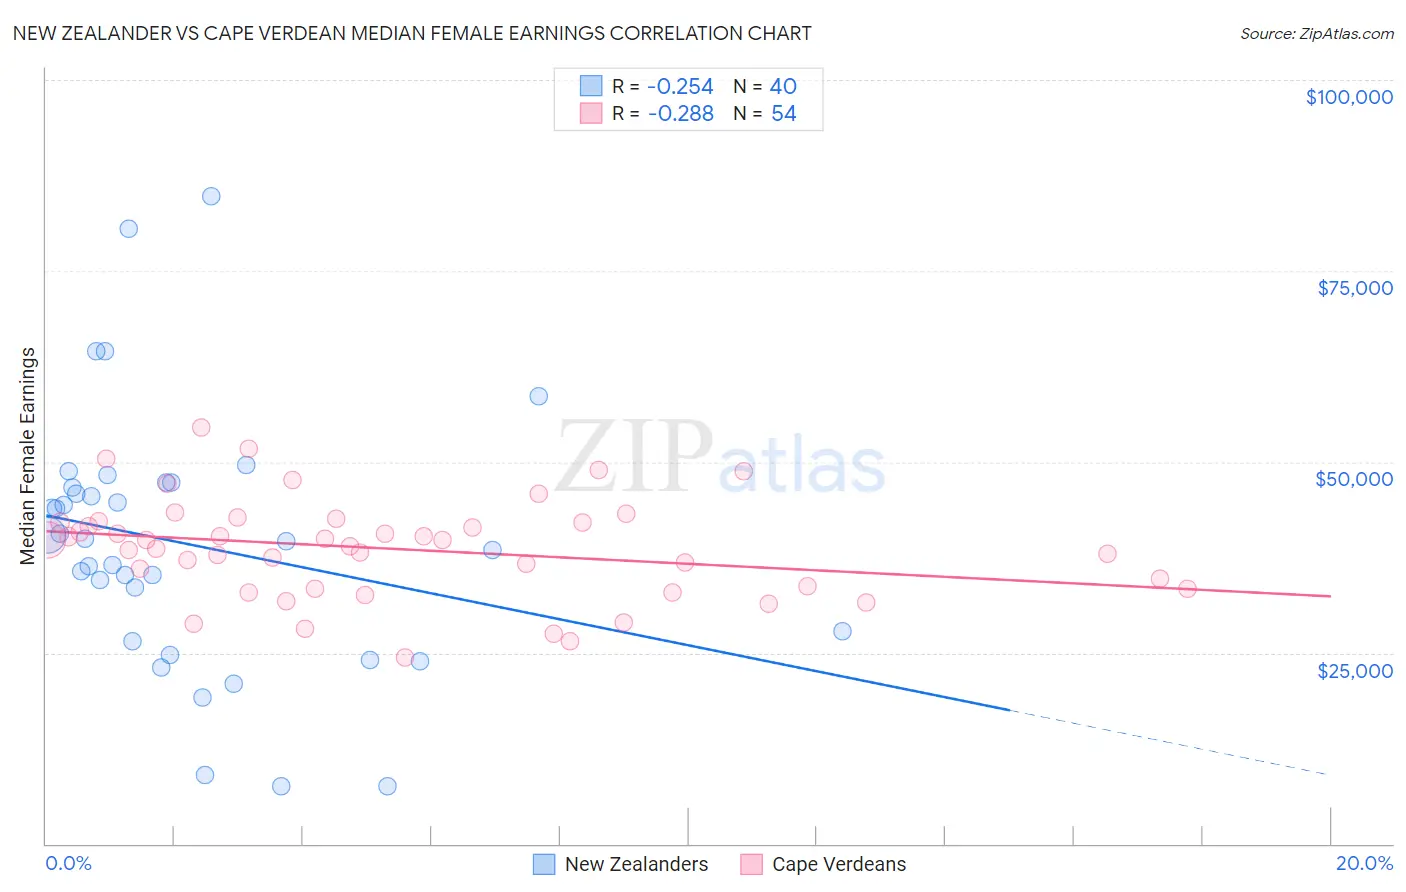
New Zealander vs Cape Verdean Median Female Earnings Correlation Chart
The statistical analysis conducted on geographies consisting of 106,911,016 people shows a weak negative correlation between the proportion of New Zealanders and median female earnings in the United States with a correlation coefficient (R) of -0.254 and weighted average of $42,446. Similarly, the statistical analysis conducted on geographies consisting of 107,559,338 people shows a weak negative correlation between the proportion of Cape Verdeans and median female earnings in the United States with a correlation coefficient (R) of -0.288 and weighted average of $38,614, a difference of 9.9%.
Median Female Earnings Correlation Summary
| Measurement | New Zealander | Cape Verdean |
| Minimum | $7,500 | $24,340 |
| Maximum | $84,792 | $54,554 |
| Range | $77,292 | $30,214 |
| Mean | $39,221 | $38,613 |
| Median | $39,778 | $39,359 |
| Interquartile 25% (IQ1) | $27,127 | $33,431 |
| Interquartile 75% (IQ3) | $46,939 | $42,075 |
| Interquartile Range (IQR) | $19,812 | $8,644 |
| Standard Deviation (Sample) | $16,864 | $6,549 |
| Standard Deviation (Population) | $16,651 | $6,488 |
Similar Demographics by Median Female Earnings
Demographics Similar to New Zealanders by Median Female Earnings
In terms of median female earnings, the demographic groups most similar to New Zealanders are Immigrants from Italy ($42,446, a difference of 0.0%), Immigrants from Albania ($42,388, a difference of 0.14%), Immigrants from Kazakhstan ($42,386, a difference of 0.14%), Immigrants from South Africa ($42,508, a difference of 0.15%), and Mongolian ($42,542, a difference of 0.23%).
| Demographics | Rating | Rank | Median Female Earnings |
| Immigrants | Austria | 99.8 /100 | #68 | Exceptional $42,824 |
| Immigrants | Spain | 99.8 /100 | #69 | Exceptional $42,815 |
| Immigrants | Ethiopia | 99.8 /100 | #70 | Exceptional $42,744 |
| Immigrants | Romania | 99.8 /100 | #71 | Exceptional $42,718 |
| Albanians | 99.8 /100 | #72 | Exceptional $42,584 |
| Mongolians | 99.7 /100 | #73 | Exceptional $42,542 |
| Immigrants | South Africa | 99.7 /100 | #74 | Exceptional $42,508 |
| New Zealanders | 99.7 /100 | #75 | Exceptional $42,446 |
| Immigrants | Italy | 99.7 /100 | #76 | Exceptional $42,446 |
| Immigrants | Albania | 99.6 /100 | #77 | Exceptional $42,388 |
| Immigrants | Kazakhstan | 99.6 /100 | #78 | Exceptional $42,386 |
| Greeks | 99.6 /100 | #79 | Exceptional $42,336 |
| Immigrants | Moldova | 99.6 /100 | #80 | Exceptional $42,304 |
| Immigrants | Southern Europe | 99.5 /100 | #81 | Exceptional $42,275 |
| Immigrants | Morocco | 99.5 /100 | #82 | Exceptional $42,229 |
Demographics Similar to Cape Verdeans by Median Female Earnings
In terms of median female earnings, the demographic groups most similar to Cape Verdeans are Immigrants from Jamaica ($38,625, a difference of 0.030%), Nepalese ($38,603, a difference of 0.030%), Immigrants from Ecuador ($38,644, a difference of 0.080%), Spaniard ($38,656, a difference of 0.11%), and Yugoslavian ($38,573, a difference of 0.11%).
| Demographics | Rating | Rank | Median Female Earnings |
| Aleuts | 11.6 /100 | #211 | Poor $38,719 |
| Guamanians/Chamorros | 11.5 /100 | #212 | Poor $38,717 |
| Jamaicans | 10.5 /100 | #213 | Poor $38,670 |
| Iraqis | 10.5 /100 | #214 | Poor $38,666 |
| Spaniards | 10.3 /100 | #215 | Poor $38,656 |
| Immigrants | Ecuador | 10.1 /100 | #216 | Poor $38,644 |
| Immigrants | Jamaica | 9.7 /100 | #217 | Tragic $38,625 |
| Cape Verdeans | 9.5 /100 | #218 | Tragic $38,614 |
| Nepalese | 9.3 /100 | #219 | Tragic $38,603 |
| Yugoslavians | 8.8 /100 | #220 | Tragic $38,573 |
| Immigrants | Azores | 8.8 /100 | #221 | Tragic $38,573 |
| Japanese | 8.1 /100 | #222 | Tragic $38,528 |
| Immigrants | Sudan | 7.8 /100 | #223 | Tragic $38,511 |
| Native Hawaiians | 7.1 /100 | #224 | Tragic $38,461 |
| French | 7.0 /100 | #225 | Tragic $38,457 |