Haitian vs Cape Verdean Median Female Earnings
COMPARE
Haitian
Cape Verdean
Median Female Earnings
Median Female Earnings Comparison
Haitians
Cape Verdeans
$36,374
MEDIAN FEMALE EARNINGS
0.1/ 100
METRIC RATING
282nd/ 347
METRIC RANK
$38,614
MEDIAN FEMALE EARNINGS
9.5/ 100
METRIC RATING
218th/ 347
METRIC RANK
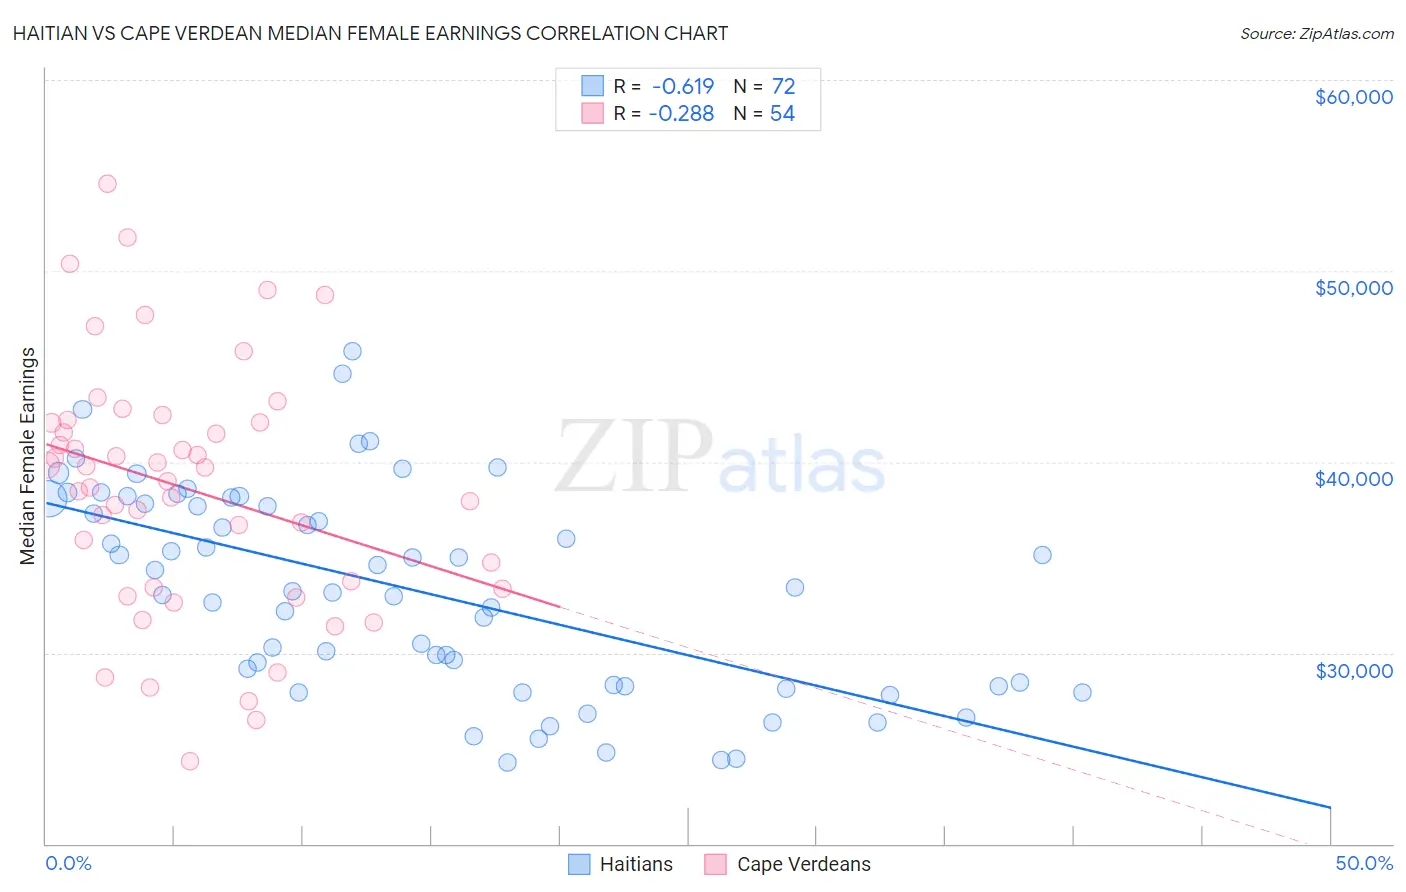
Haitian vs Cape Verdean Median Female Earnings Correlation Chart
The statistical analysis conducted on geographies consisting of 287,899,387 people shows a significant negative correlation between the proportion of Haitians and median female earnings in the United States with a correlation coefficient (R) of -0.619 and weighted average of $36,374. Similarly, the statistical analysis conducted on geographies consisting of 107,559,338 people shows a weak negative correlation between the proportion of Cape Verdeans and median female earnings in the United States with a correlation coefficient (R) of -0.288 and weighted average of $38,614, a difference of 6.2%.
Median Female Earnings Correlation Summary
| Measurement | Haitian | Cape Verdean |
| Minimum | $24,245 | $24,340 |
| Maximum | $45,799 | $54,554 |
| Range | $21,554 | $30,214 |
| Mean | $33,333 | $38,613 |
| Median | $33,334 | $39,359 |
| Interquartile 25% (IQ1) | $28,287 | $33,431 |
| Interquartile 75% (IQ3) | $37,934 | $42,075 |
| Interquartile Range (IQR) | $9,647 | $8,644 |
| Standard Deviation (Sample) | $5,376 | $6,549 |
| Standard Deviation (Population) | $5,339 | $6,488 |
Similar Demographics by Median Female Earnings
Demographics Similar to Haitians by Median Female Earnings
In terms of median female earnings, the demographic groups most similar to Haitians are Spanish American ($36,391, a difference of 0.050%), Iroquois ($36,408, a difference of 0.090%), Immigrants from Caribbean ($36,414, a difference of 0.11%), U.S. Virgin Islander ($36,424, a difference of 0.14%), and Marshallese ($36,459, a difference of 0.24%).
| Demographics | Rating | Rank | Median Female Earnings |
| Africans | 0.1 /100 | #275 | Tragic $36,530 |
| Central Americans | 0.1 /100 | #276 | Tragic $36,492 |
| Marshallese | 0.1 /100 | #277 | Tragic $36,459 |
| U.S. Virgin Islanders | 0.1 /100 | #278 | Tragic $36,424 |
| Immigrants | Caribbean | 0.1 /100 | #279 | Tragic $36,414 |
| Iroquois | 0.1 /100 | #280 | Tragic $36,408 |
| Spanish Americans | 0.1 /100 | #281 | Tragic $36,391 |
| Haitians | 0.1 /100 | #282 | Tragic $36,374 |
| Immigrants | Haiti | 0.1 /100 | #283 | Tragic $36,203 |
| Indonesians | 0.1 /100 | #284 | Tragic $36,140 |
| Paiute | 0.1 /100 | #285 | Tragic $36,056 |
| Osage | 0.0 /100 | #286 | Tragic $36,034 |
| Immigrants | Nicaragua | 0.0 /100 | #287 | Tragic $36,023 |
| Immigrants | Zaire | 0.0 /100 | #288 | Tragic $36,017 |
| Bangladeshis | 0.0 /100 | #289 | Tragic $35,960 |
Demographics Similar to Cape Verdeans by Median Female Earnings
In terms of median female earnings, the demographic groups most similar to Cape Verdeans are Immigrants from Jamaica ($38,625, a difference of 0.030%), Nepalese ($38,603, a difference of 0.030%), Immigrants from Ecuador ($38,644, a difference of 0.080%), Spaniard ($38,656, a difference of 0.11%), and Yugoslavian ($38,573, a difference of 0.11%).
| Demographics | Rating | Rank | Median Female Earnings |
| Aleuts | 11.6 /100 | #211 | Poor $38,719 |
| Guamanians/Chamorros | 11.5 /100 | #212 | Poor $38,717 |
| Jamaicans | 10.5 /100 | #213 | Poor $38,670 |
| Iraqis | 10.5 /100 | #214 | Poor $38,666 |
| Spaniards | 10.3 /100 | #215 | Poor $38,656 |
| Immigrants | Ecuador | 10.1 /100 | #216 | Poor $38,644 |
| Immigrants | Jamaica | 9.7 /100 | #217 | Tragic $38,625 |
| Cape Verdeans | 9.5 /100 | #218 | Tragic $38,614 |
| Nepalese | 9.3 /100 | #219 | Tragic $38,603 |
| Yugoslavians | 8.8 /100 | #220 | Tragic $38,573 |
| Immigrants | Azores | 8.8 /100 | #221 | Tragic $38,573 |
| Japanese | 8.1 /100 | #222 | Tragic $38,528 |
| Immigrants | Sudan | 7.8 /100 | #223 | Tragic $38,511 |
| Native Hawaiians | 7.1 /100 | #224 | Tragic $38,461 |
| French | 7.0 /100 | #225 | Tragic $38,457 |