Barbadian vs Laotian Median Male Earnings
COMPARE
Barbadian
Laotian
Median Male Earnings
Median Male Earnings Comparison
Barbadians
Laotians
$51,236
MEDIAN MALE EARNINGS
3.9/ 100
METRIC RATING
231st/ 347
METRIC RANK
$59,351
MEDIAN MALE EARNINGS
99.2/ 100
METRIC RATING
91st/ 347
METRIC RANK
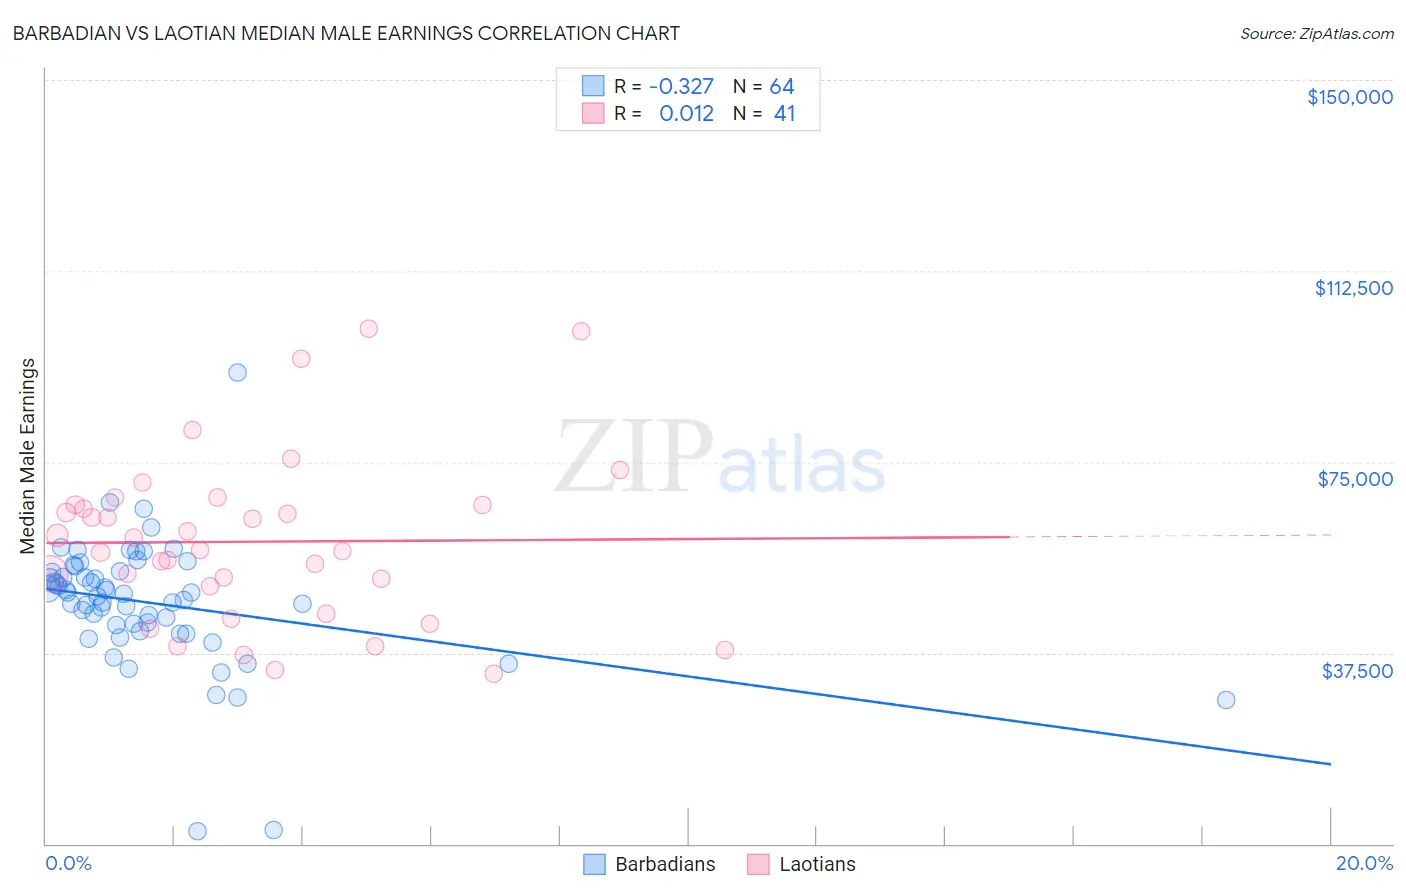
Barbadian vs Laotian Median Male Earnings Correlation Chart
The statistical analysis conducted on geographies consisting of 141,271,676 people shows a mild negative correlation between the proportion of Barbadians and median male earnings in the United States with a correlation coefficient (R) of -0.327 and weighted average of $51,236. Similarly, the statistical analysis conducted on geographies consisting of 224,845,741 people shows no correlation between the proportion of Laotians and median male earnings in the United States with a correlation coefficient (R) of 0.012 and weighted average of $59,351, a difference of 15.8%.
Median Male Earnings Correlation Summary
| Measurement | Barbadian | Laotian |
| Minimum | $2,499 | $33,481 |
| Maximum | $92,582 | $101,250 |
| Range | $90,083 | $67,769 |
| Mean | $47,251 | $59,314 |
| Median | $48,821 | $57,776 |
| Interquartile 25% (IQ1) | $42,256 | $47,781 |
| Interquartile 75% (IQ3) | $53,422 | $66,498 |
| Interquartile Range (IQR) | $11,166 | $18,717 |
| Standard Deviation (Sample) | $12,825 | $16,323 |
| Standard Deviation (Population) | $12,724 | $16,122 |
Similar Demographics by Median Male Earnings
Demographics Similar to Barbadians by Median Male Earnings
In terms of median male earnings, the demographic groups most similar to Barbadians are Sudanese ($51,216, a difference of 0.040%), Aleut ($51,168, a difference of 0.13%), Immigrants from Nigeria ($51,310, a difference of 0.14%), Cape Verdean ($51,103, a difference of 0.26%), and Immigrants from Trinidad and Tobago ($51,376, a difference of 0.27%).
| Demographics | Rating | Rank | Median Male Earnings |
| Immigrants | Cambodia | 5.5 /100 | #224 | Tragic $51,594 |
| Immigrants | Sudan | 5.0 /100 | #225 | Tragic $51,489 |
| Japanese | 4.9 /100 | #226 | Tragic $51,473 |
| Trinidadians and Tobagonians | 4.8 /100 | #227 | Tragic $51,446 |
| Samoans | 4.6 /100 | #228 | Tragic $51,389 |
| Immigrants | Trinidad and Tobago | 4.5 /100 | #229 | Tragic $51,376 |
| Immigrants | Nigeria | 4.2 /100 | #230 | Tragic $51,310 |
| Barbadians | 3.9 /100 | #231 | Tragic $51,236 |
| Sudanese | 3.9 /100 | #232 | Tragic $51,216 |
| Aleuts | 3.7 /100 | #233 | Tragic $51,168 |
| Cape Verdeans | 3.5 /100 | #234 | Tragic $51,103 |
| Immigrants | Western Africa | 3.0 /100 | #235 | Tragic $50,940 |
| Pennsylvania Germans | 2.8 /100 | #236 | Tragic $50,878 |
| Immigrants | Barbados | 2.6 /100 | #237 | Tragic $50,795 |
| Malaysians | 2.5 /100 | #238 | Tragic $50,772 |
Demographics Similar to Laotians by Median Male Earnings
In terms of median male earnings, the demographic groups most similar to Laotians are Austrian ($59,359, a difference of 0.010%), Immigrants from Moldova ($59,417, a difference of 0.11%), Immigrants from Kazakhstan ($59,278, a difference of 0.12%), Immigrants from Southern Europe ($59,217, a difference of 0.23%), and Immigrants from Argentina ($59,491, a difference of 0.24%).
| Demographics | Rating | Rank | Median Male Earnings |
| Afghans | 99.3 /100 | #84 | Exceptional $59,554 |
| Italians | 99.3 /100 | #85 | Exceptional $59,551 |
| Immigrants | England | 99.3 /100 | #86 | Exceptional $59,527 |
| Macedonians | 99.3 /100 | #87 | Exceptional $59,522 |
| Immigrants | Argentina | 99.3 /100 | #88 | Exceptional $59,491 |
| Immigrants | Moldova | 99.2 /100 | #89 | Exceptional $59,417 |
| Austrians | 99.2 /100 | #90 | Exceptional $59,359 |
| Laotians | 99.2 /100 | #91 | Exceptional $59,351 |
| Immigrants | Kazakhstan | 99.1 /100 | #92 | Exceptional $59,278 |
| Immigrants | Southern Europe | 99.0 /100 | #93 | Exceptional $59,217 |
| Immigrants | North Macedonia | 99.0 /100 | #94 | Exceptional $59,189 |
| Immigrants | Lebanon | 98.6 /100 | #95 | Exceptional $58,835 |
| Albanians | 98.4 /100 | #96 | Exceptional $58,680 |
| Northern Europeans | 98.2 /100 | #97 | Exceptional $58,588 |
| Jordanians | 98.1 /100 | #98 | Exceptional $58,500 |