Barbadian vs Native Hawaiian Median Male Earnings
COMPARE
Barbadian
Native Hawaiian
Median Male Earnings
Median Male Earnings Comparison
Barbadians
Native Hawaiians
$51,236
MEDIAN MALE EARNINGS
3.9/ 100
METRIC RATING
231st/ 347
METRIC RANK
$52,306
MEDIAN MALE EARNINGS
10.5/ 100
METRIC RATING
213th/ 347
METRIC RANK
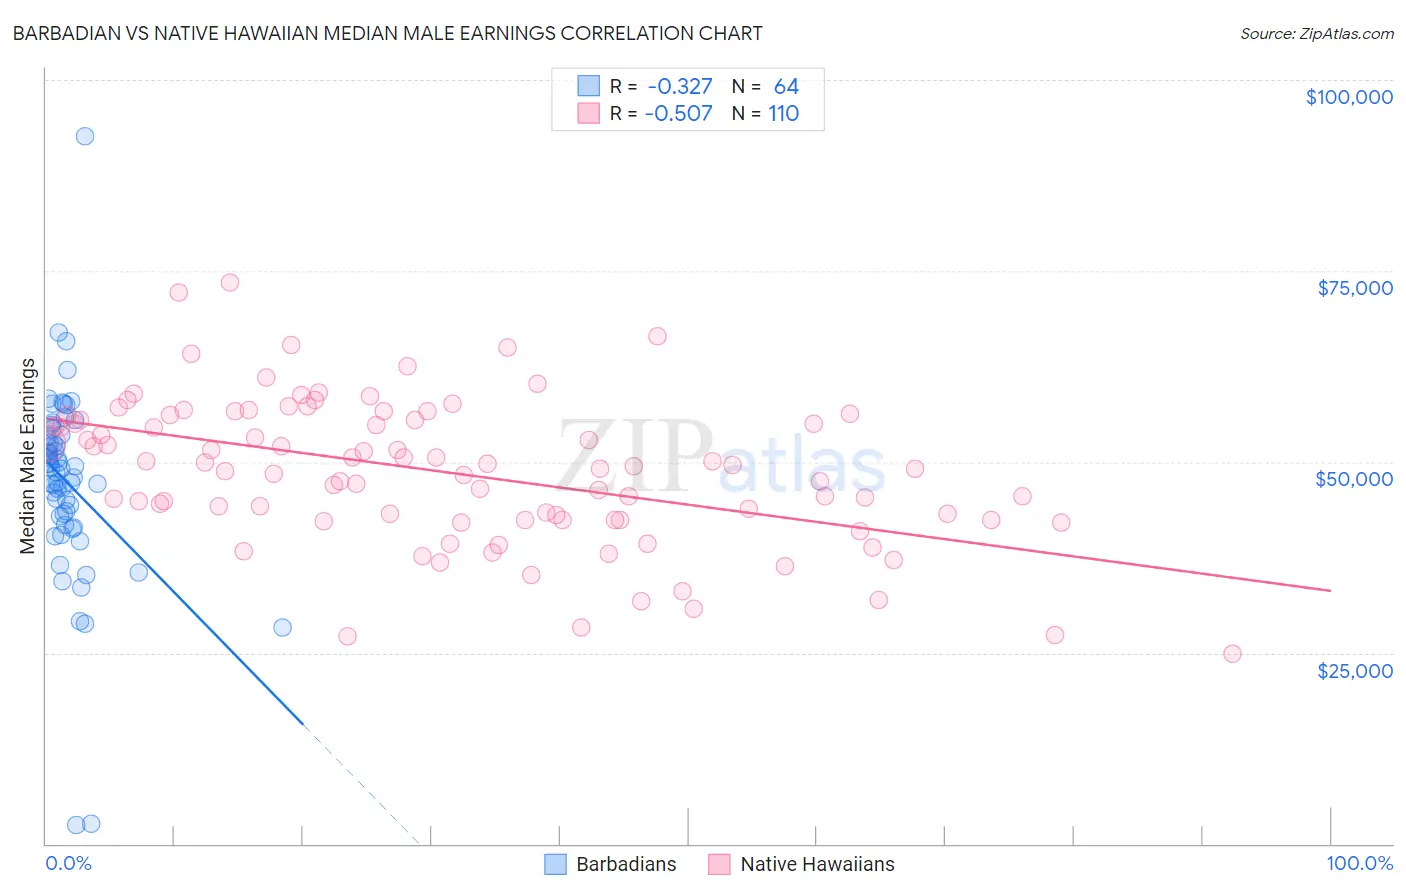
Barbadian vs Native Hawaiian Median Male Earnings Correlation Chart
The statistical analysis conducted on geographies consisting of 141,271,676 people shows a mild negative correlation between the proportion of Barbadians and median male earnings in the United States with a correlation coefficient (R) of -0.327 and weighted average of $51,236. Similarly, the statistical analysis conducted on geographies consisting of 332,009,259 people shows a substantial negative correlation between the proportion of Native Hawaiians and median male earnings in the United States with a correlation coefficient (R) of -0.507 and weighted average of $52,306, a difference of 2.1%.
Median Male Earnings Correlation Summary
| Measurement | Barbadian | Native Hawaiian |
| Minimum | $2,499 | $24,830 |
| Maximum | $92,582 | $73,412 |
| Range | $90,083 | $48,582 |
| Mean | $47,251 | $48,621 |
| Median | $48,821 | $49,328 |
| Interquartile 25% (IQ1) | $42,256 | $42,387 |
| Interquartile 75% (IQ3) | $53,422 | $55,422 |
| Interquartile Range (IQR) | $11,166 | $13,035 |
| Standard Deviation (Sample) | $12,825 | $9,458 |
| Standard Deviation (Population) | $12,724 | $9,414 |
Demographics Similar to Barbadians and Native Hawaiians by Median Male Earnings
In terms of median male earnings, the demographic groups most similar to Barbadians are Sudanese ($51,216, a difference of 0.040%), Immigrants from Nigeria ($51,310, a difference of 0.14%), Immigrants from Trinidad and Tobago ($51,376, a difference of 0.27%), Samoan ($51,389, a difference of 0.30%), and Trinidadian and Tobagonian ($51,446, a difference of 0.41%). Similarly, the demographic groups most similar to Native Hawaiians are Cajun ($52,325, a difference of 0.040%), Nonimmigrants ($52,170, a difference of 0.26%), Immigrants from Cameroon ($52,119, a difference of 0.36%), Immigrants from Venezuela ($52,041, a difference of 0.51%), and Nigerian ($52,039, a difference of 0.51%).
| Demographics | Rating | Rank | Median Male Earnings |
| Cajuns | 10.7 /100 | #212 | Poor $52,325 |
| Native Hawaiians | 10.5 /100 | #213 | Poor $52,306 |
| Immigrants | Nonimmigrants | 9.3 /100 | #214 | Tragic $52,170 |
| Immigrants | Cameroon | 8.9 /100 | #215 | Tragic $52,119 |
| Immigrants | Venezuela | 8.3 /100 | #216 | Tragic $52,041 |
| Nigerians | 8.3 /100 | #217 | Tragic $52,039 |
| Immigrants | Panama | 7.7 /100 | #218 | Tragic $51,962 |
| Immigrants | Ghana | 6.9 /100 | #219 | Tragic $51,836 |
| Immigrants | Armenia | 6.6 /100 | #220 | Tragic $51,793 |
| Immigrants | Senegal | 5.8 /100 | #221 | Tragic $51,647 |
| Immigrants | Bangladesh | 5.8 /100 | #222 | Tragic $51,642 |
| Ecuadorians | 5.5 /100 | #223 | Tragic $51,596 |
| Immigrants | Cambodia | 5.5 /100 | #224 | Tragic $51,594 |
| Immigrants | Sudan | 5.0 /100 | #225 | Tragic $51,489 |
| Japanese | 4.9 /100 | #226 | Tragic $51,473 |
| Trinidadians and Tobagonians | 4.8 /100 | #227 | Tragic $51,446 |
| Samoans | 4.6 /100 | #228 | Tragic $51,389 |
| Immigrants | Trinidad and Tobago | 4.5 /100 | #229 | Tragic $51,376 |
| Immigrants | Nigeria | 4.2 /100 | #230 | Tragic $51,310 |
| Barbadians | 3.9 /100 | #231 | Tragic $51,236 |
| Sudanese | 3.9 /100 | #232 | Tragic $51,216 |