Barbadian vs Kenyan Median Male Earnings
COMPARE
Barbadian
Kenyan
Median Male Earnings
Median Male Earnings Comparison
Barbadians
Kenyans
$51,236
MEDIAN MALE EARNINGS
3.9/ 100
METRIC RATING
231st/ 347
METRIC RANK
$53,647
MEDIAN MALE EARNINGS
30.4/ 100
METRIC RATING
193rd/ 347
METRIC RANK
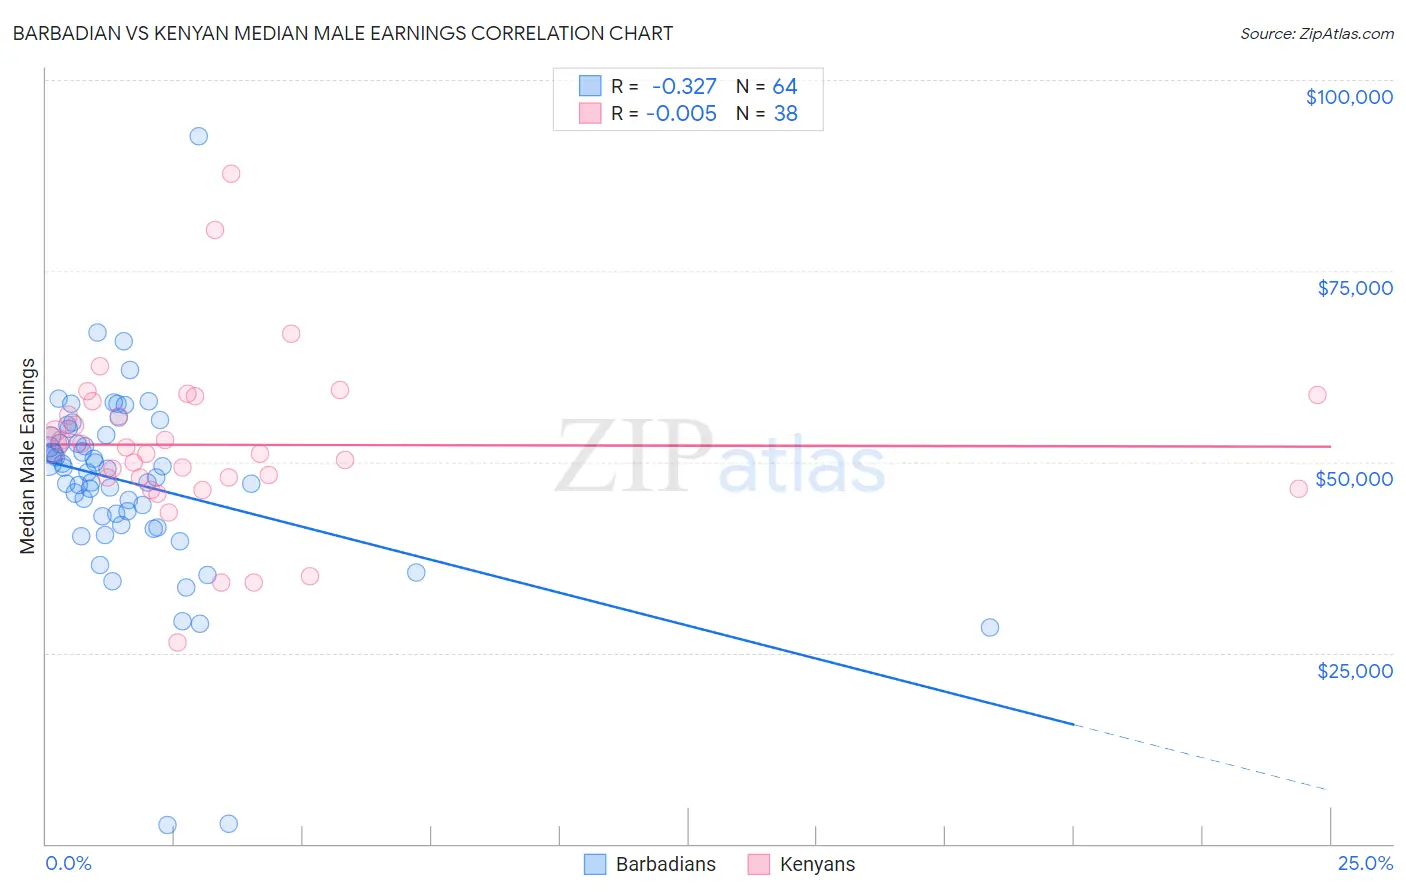
Barbadian vs Kenyan Median Male Earnings Correlation Chart
The statistical analysis conducted on geographies consisting of 141,271,676 people shows a mild negative correlation between the proportion of Barbadians and median male earnings in the United States with a correlation coefficient (R) of -0.327 and weighted average of $51,236. Similarly, the statistical analysis conducted on geographies consisting of 168,231,087 people shows no correlation between the proportion of Kenyans and median male earnings in the United States with a correlation coefficient (R) of -0.005 and weighted average of $53,647, a difference of 4.7%.
Median Male Earnings Correlation Summary
| Measurement | Barbadian | Kenyan |
| Minimum | $2,499 | $26,389 |
| Maximum | $92,582 | $87,784 |
| Range | $90,083 | $61,395 |
| Mean | $47,251 | $52,229 |
| Median | $48,821 | $51,523 |
| Interquartile 25% (IQ1) | $42,256 | $47,893 |
| Interquartile 75% (IQ3) | $53,422 | $57,971 |
| Interquartile Range (IQR) | $11,166 | $10,078 |
| Standard Deviation (Sample) | $12,825 | $11,163 |
| Standard Deviation (Population) | $12,724 | $11,016 |
Similar Demographics by Median Male Earnings
Demographics Similar to Barbadians by Median Male Earnings
In terms of median male earnings, the demographic groups most similar to Barbadians are Sudanese ($51,216, a difference of 0.040%), Aleut ($51,168, a difference of 0.13%), Immigrants from Nigeria ($51,310, a difference of 0.14%), Cape Verdean ($51,103, a difference of 0.26%), and Immigrants from Trinidad and Tobago ($51,376, a difference of 0.27%).
| Demographics | Rating | Rank | Median Male Earnings |
| Immigrants | Cambodia | 5.5 /100 | #224 | Tragic $51,594 |
| Immigrants | Sudan | 5.0 /100 | #225 | Tragic $51,489 |
| Japanese | 4.9 /100 | #226 | Tragic $51,473 |
| Trinidadians and Tobagonians | 4.8 /100 | #227 | Tragic $51,446 |
| Samoans | 4.6 /100 | #228 | Tragic $51,389 |
| Immigrants | Trinidad and Tobago | 4.5 /100 | #229 | Tragic $51,376 |
| Immigrants | Nigeria | 4.2 /100 | #230 | Tragic $51,310 |
| Barbadians | 3.9 /100 | #231 | Tragic $51,236 |
| Sudanese | 3.9 /100 | #232 | Tragic $51,216 |
| Aleuts | 3.7 /100 | #233 | Tragic $51,168 |
| Cape Verdeans | 3.5 /100 | #234 | Tragic $51,103 |
| Immigrants | Western Africa | 3.0 /100 | #235 | Tragic $50,940 |
| Pennsylvania Germans | 2.8 /100 | #236 | Tragic $50,878 |
| Immigrants | Barbados | 2.6 /100 | #237 | Tragic $50,795 |
| Malaysians | 2.5 /100 | #238 | Tragic $50,772 |
Demographics Similar to Kenyans by Median Male Earnings
In terms of median male earnings, the demographic groups most similar to Kenyans are Scotch-Irish ($53,658, a difference of 0.020%), Guamanian/Chamorro ($53,661, a difference of 0.030%), Uruguayan ($53,680, a difference of 0.060%), Puget Sound Salish ($53,704, a difference of 0.11%), and Immigrants from Eastern Africa ($53,713, a difference of 0.12%).
| Demographics | Rating | Rank | Median Male Earnings |
| Colombians | 34.4 /100 | #186 | Fair $53,832 |
| Immigrants | Eritrea | 31.8 /100 | #187 | Fair $53,715 |
| Immigrants | Eastern Africa | 31.8 /100 | #188 | Fair $53,713 |
| Puget Sound Salish | 31.6 /100 | #189 | Fair $53,704 |
| Uruguayans | 31.1 /100 | #190 | Fair $53,680 |
| Guamanians/Chamorros | 30.7 /100 | #191 | Fair $53,661 |
| Scotch-Irish | 30.6 /100 | #192 | Fair $53,658 |
| Kenyans | 30.4 /100 | #193 | Fair $53,647 |
| Spanish | 29.0 /100 | #194 | Fair $53,576 |
| Immigrants | Azores | 27.5 /100 | #195 | Fair $53,503 |
| Immigrants | Africa | 26.6 /100 | #196 | Fair $53,457 |
| Immigrants | Kenya | 26.0 /100 | #197 | Fair $53,427 |
| Immigrants | Costa Rica | 22.6 /100 | #198 | Fair $53,237 |
| Tongans | 22.3 /100 | #199 | Fair $53,218 |
| Immigrants | Thailand | 17.5 /100 | #200 | Poor $52,908 |