Barbadian vs Immigrants from Fiji Median Male Earnings
COMPARE
Barbadian
Immigrants from Fiji
Median Male Earnings
Median Male Earnings Comparison
Barbadians
Immigrants from Fiji
$51,236
MEDIAN MALE EARNINGS
3.9/ 100
METRIC RATING
231st/ 347
METRIC RANK
$54,958
MEDIAN MALE EARNINGS
61.2/ 100
METRIC RATING
167th/ 347
METRIC RANK
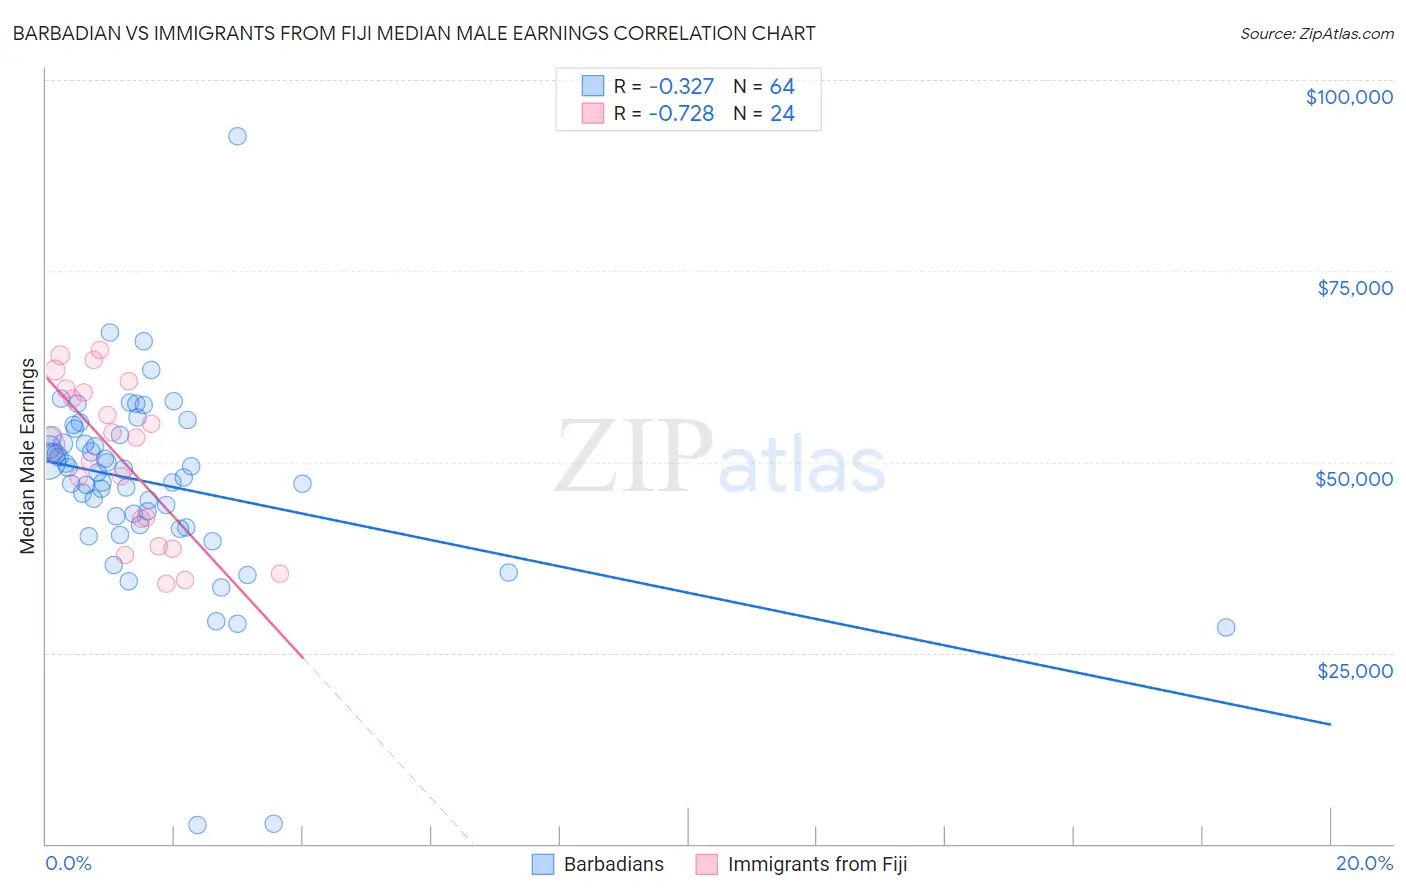
Barbadian vs Immigrants from Fiji Median Male Earnings Correlation Chart
The statistical analysis conducted on geographies consisting of 141,271,676 people shows a mild negative correlation between the proportion of Barbadians and median male earnings in the United States with a correlation coefficient (R) of -0.327 and weighted average of $51,236. Similarly, the statistical analysis conducted on geographies consisting of 93,749,619 people shows a strong negative correlation between the proportion of Immigrants from Fiji and median male earnings in the United States with a correlation coefficient (R) of -0.728 and weighted average of $54,958, a difference of 7.3%.
Median Male Earnings Correlation Summary
| Measurement | Barbadian | Immigrants from Fiji |
| Minimum | $2,499 | $34,054 |
| Maximum | $92,582 | $64,713 |
| Range | $90,083 | $30,659 |
| Mean | $47,251 | $50,520 |
| Median | $48,821 | $52,738 |
| Interquartile 25% (IQ1) | $42,256 | $40,707 |
| Interquartile 75% (IQ3) | $53,422 | $59,322 |
| Interquartile Range (IQR) | $11,166 | $18,615 |
| Standard Deviation (Sample) | $12,825 | $10,211 |
| Standard Deviation (Population) | $12,724 | $9,996 |
Similar Demographics by Median Male Earnings
Demographics Similar to Barbadians by Median Male Earnings
In terms of median male earnings, the demographic groups most similar to Barbadians are Sudanese ($51,216, a difference of 0.040%), Aleut ($51,168, a difference of 0.13%), Immigrants from Nigeria ($51,310, a difference of 0.14%), Cape Verdean ($51,103, a difference of 0.26%), and Immigrants from Trinidad and Tobago ($51,376, a difference of 0.27%).
| Demographics | Rating | Rank | Median Male Earnings |
| Immigrants | Cambodia | 5.5 /100 | #224 | Tragic $51,594 |
| Immigrants | Sudan | 5.0 /100 | #225 | Tragic $51,489 |
| Japanese | 4.9 /100 | #226 | Tragic $51,473 |
| Trinidadians and Tobagonians | 4.8 /100 | #227 | Tragic $51,446 |
| Samoans | 4.6 /100 | #228 | Tragic $51,389 |
| Immigrants | Trinidad and Tobago | 4.5 /100 | #229 | Tragic $51,376 |
| Immigrants | Nigeria | 4.2 /100 | #230 | Tragic $51,310 |
| Barbadians | 3.9 /100 | #231 | Tragic $51,236 |
| Sudanese | 3.9 /100 | #232 | Tragic $51,216 |
| Aleuts | 3.7 /100 | #233 | Tragic $51,168 |
| Cape Verdeans | 3.5 /100 | #234 | Tragic $51,103 |
| Immigrants | Western Africa | 3.0 /100 | #235 | Tragic $50,940 |
| Pennsylvania Germans | 2.8 /100 | #236 | Tragic $50,878 |
| Immigrants | Barbados | 2.6 /100 | #237 | Tragic $50,795 |
| Malaysians | 2.5 /100 | #238 | Tragic $50,772 |
Demographics Similar to Immigrants from Fiji by Median Male Earnings
In terms of median male earnings, the demographic groups most similar to Immigrants from Fiji are German ($54,974, a difference of 0.030%), Immigrants from Vietnam ($54,913, a difference of 0.080%), Immigrants from Portugal ($55,182, a difference of 0.41%), French Canadian ($54,722, a difference of 0.43%), and Finnish ($54,721, a difference of 0.43%).
| Demographics | Rating | Rank | Median Male Earnings |
| Basques | 70.3 /100 | #160 | Good $55,370 |
| Belgians | 70.1 /100 | #161 | Good $55,361 |
| French | 69.9 /100 | #162 | Good $55,350 |
| Ugandans | 68.6 /100 | #163 | Good $55,290 |
| Immigrants | South Eastern Asia | 67.6 /100 | #164 | Good $55,241 |
| Immigrants | Portugal | 66.3 /100 | #165 | Good $55,182 |
| Germans | 61.6 /100 | #166 | Good $54,974 |
| Immigrants | Fiji | 61.2 /100 | #167 | Good $54,958 |
| Immigrants | Vietnam | 60.2 /100 | #168 | Good $54,913 |
| French Canadians | 55.6 /100 | #169 | Average $54,722 |
| Finns | 55.6 /100 | #170 | Average $54,721 |
| Immigrants | Peru | 54.9 /100 | #171 | Average $54,695 |
| Welsh | 53.8 /100 | #172 | Average $54,647 |
| South American Indians | 50.4 /100 | #173 | Average $54,508 |
| South Americans | 50.0 /100 | #174 | Average $54,492 |