Barbadian vs Laotian Disability Age 18 to 34
COMPARE
Barbadian
Laotian
Disability Age 18 to 34
Disability Age 18 to 34 Comparison
Barbadians
Laotians
6.1%
DISABILITY AGE 18 TO 34
98.3/ 100
METRIC RATING
83rd/ 347
METRIC RANK
6.2%
DISABILITY AGE 18 TO 34
96.4/ 100
METRIC RATING
102nd/ 347
METRIC RANK
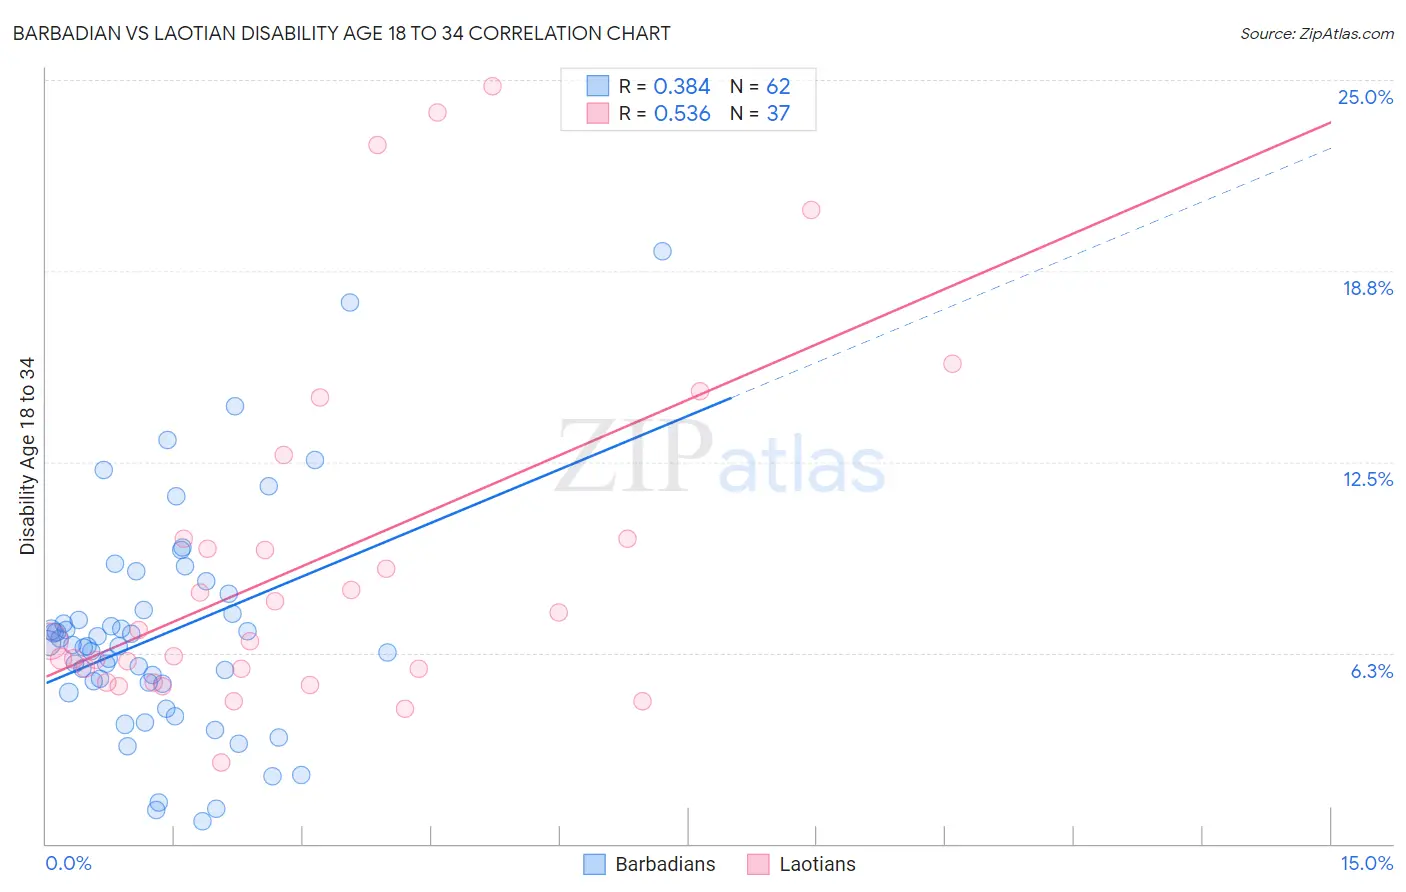
Barbadian vs Laotian Disability Age 18 to 34 Correlation Chart
The statistical analysis conducted on geographies consisting of 141,268,708 people shows a mild positive correlation between the proportion of Barbadians and percentage of population with a disability between the ages 18 and 35 in the United States with a correlation coefficient (R) of 0.384 and weighted average of 6.1%. Similarly, the statistical analysis conducted on geographies consisting of 224,649,729 people shows a substantial positive correlation between the proportion of Laotians and percentage of population with a disability between the ages 18 and 35 in the United States with a correlation coefficient (R) of 0.536 and weighted average of 6.2%, a difference of 1.5%.
Disability Age 18 to 34 Correlation Summary
| Measurement | Barbadian | Laotian |
| Minimum | 0.73% | 2.7% |
| Maximum | 19.4% | 24.8% |
| Range | 18.7% | 22.1% |
| Mean | 6.9% | 9.2% |
| Median | 6.5% | 6.6% |
| Interquartile 25% (IQ1) | 5.3% | 5.5% |
| Interquartile 75% (IQ3) | 7.6% | 10.0% |
| Interquartile Range (IQR) | 2.4% | 4.5% |
| Standard Deviation (Sample) | 3.6% | 5.8% |
| Standard Deviation (Population) | 3.6% | 5.7% |
Demographics Similar to Barbadians and Laotians by Disability Age 18 to 34
In terms of disability age 18 to 34, the demographic groups most similar to Barbadians are Israeli (6.1%, a difference of 0.030%), Immigrants from Northern Africa (6.1%, a difference of 0.060%), Immigrants from Ireland (6.1%, a difference of 0.11%), Immigrants from Kuwait (6.2%, a difference of 0.33%), and Immigrants from Eastern Europe (6.2%, a difference of 0.41%). Similarly, the demographic groups most similar to Laotians are Immigrants from Jamaica (6.2%, a difference of 0.020%), Immigrants from Albania (6.2%, a difference of 0.18%), Immigrants from Ethiopia (6.2%, a difference of 0.30%), Immigrants from Syria (6.2%, a difference of 0.51%), and Uruguayan (6.2%, a difference of 0.55%).
| Demographics | Rating | Rank | Disability Age 18 to 34 |
| Immigrants | Northern Africa | 98.4 /100 | #82 | Exceptional 6.1% |
| Barbadians | 98.3 /100 | #83 | Exceptional 6.1% |
| Israelis | 98.3 /100 | #84 | Exceptional 6.1% |
| Immigrants | Ireland | 98.2 /100 | #85 | Exceptional 6.1% |
| Immigrants | Kuwait | 98.0 /100 | #86 | Exceptional 6.2% |
| Immigrants | Eastern Europe | 97.9 /100 | #87 | Exceptional 6.2% |
| Cambodians | 97.8 /100 | #88 | Exceptional 6.2% |
| Turks | 97.8 /100 | #89 | Exceptional 6.2% |
| Immigrants | Vietnam | 97.7 /100 | #90 | Exceptional 6.2% |
| Immigrants | Philippines | 97.6 /100 | #91 | Exceptional 6.2% |
| Jordanians | 97.6 /100 | #92 | Exceptional 6.2% |
| Immigrants | Immigrants | 97.6 /100 | #93 | Exceptional 6.2% |
| Immigrants | Kazakhstan | 97.5 /100 | #94 | Exceptional 6.2% |
| Central Americans | 97.5 /100 | #95 | Exceptional 6.2% |
| Immigrants | Uruguay | 97.4 /100 | #96 | Exceptional 6.2% |
| Uruguayans | 97.3 /100 | #97 | Exceptional 6.2% |
| Immigrants | Syria | 97.2 /100 | #98 | Exceptional 6.2% |
| Immigrants | Ethiopia | 96.9 /100 | #99 | Exceptional 6.2% |
| Immigrants | Albania | 96.7 /100 | #100 | Exceptional 6.2% |
| Immigrants | Jamaica | 96.4 /100 | #101 | Exceptional 6.2% |
| Laotians | 96.4 /100 | #102 | Exceptional 6.2% |