Barbadian vs Laotian College, 1 year or more
COMPARE
Barbadian
Laotian
College, 1 year or more
College, 1 year or more Comparison
Barbadians
Laotians
56.0%
COLLEGE, 1 YEAR OR MORE
1.3/ 100
METRIC RATING
238th/ 347
METRIC RANK
62.8%
COLLEGE, 1 YEAR OR MORE
98.7/ 100
METRIC RATING
81st/ 347
METRIC RANK
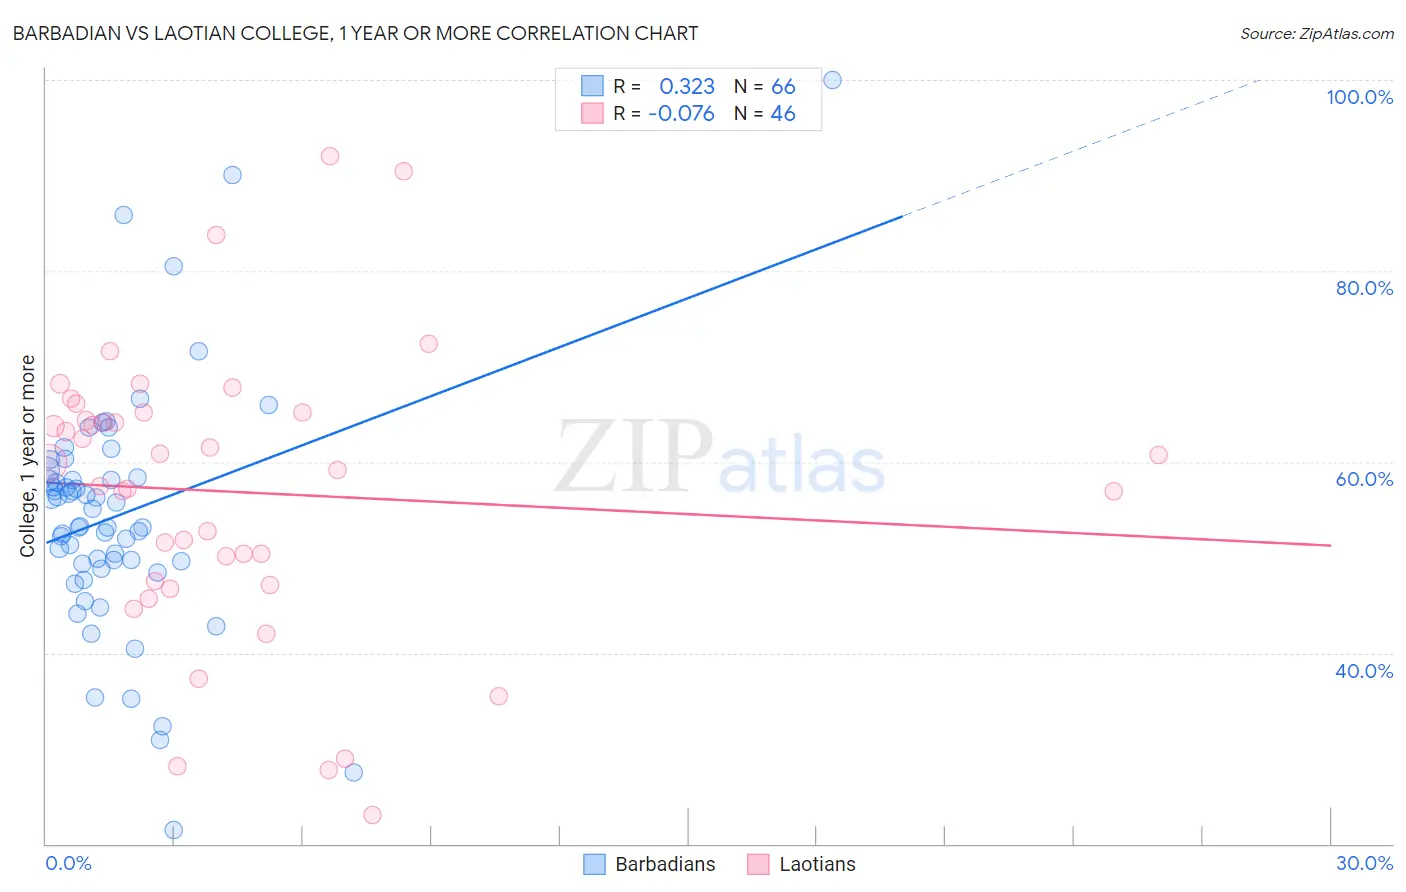
Barbadian vs Laotian College, 1 year or more Correlation Chart
The statistical analysis conducted on geographies consisting of 141,304,122 people shows a mild positive correlation between the proportion of Barbadians and percentage of population with at least college, 1 year or more education in the United States with a correlation coefficient (R) of 0.323 and weighted average of 56.0%. Similarly, the statistical analysis conducted on geographies consisting of 224,861,279 people shows a slight negative correlation between the proportion of Laotians and percentage of population with at least college, 1 year or more education in the United States with a correlation coefficient (R) of -0.076 and weighted average of 62.8%, a difference of 12.2%.
College, 1 year or more Correlation Summary
| Measurement | Barbadian | Laotian |
| Minimum | 21.4% | 23.0% |
| Maximum | 100.0% | 92.1% |
| Range | 78.6% | 69.0% |
| Mean | 54.5% | 56.9% |
| Median | 54.2% | 59.6% |
| Interquartile 25% (IQ1) | 49.4% | 47.5% |
| Interquartile 75% (IQ3) | 58.3% | 65.1% |
| Interquartile Range (IQR) | 8.9% | 17.7% |
| Standard Deviation (Sample) | 13.0% | 15.0% |
| Standard Deviation (Population) | 12.9% | 14.8% |
Similar Demographics by College, 1 year or more
Demographics Similar to Barbadians by College, 1 year or more
In terms of college, 1 year or more, the demographic groups most similar to Barbadians are Puget Sound Salish (55.9%, a difference of 0.20%), Samoan (56.2%, a difference of 0.27%), Trinidadian and Tobagonian (55.8%, a difference of 0.30%), French American Indian (55.8%, a difference of 0.34%), and Iroquois (56.2%, a difference of 0.38%).
| Demographics | Rating | Rank | College, 1 year or more |
| Immigrants | Burma/Myanmar | 2.7 /100 | #231 | Tragic 56.6% |
| Immigrants | Bangladesh | 2.6 /100 | #232 | Tragic 56.6% |
| Immigrants | Nonimmigrants | 2.5 /100 | #233 | Tragic 56.5% |
| Spanish Americans | 1.8 /100 | #234 | Tragic 56.3% |
| West Indians | 1.8 /100 | #235 | Tragic 56.3% |
| Iroquois | 1.7 /100 | #236 | Tragic 56.2% |
| Samoans | 1.6 /100 | #237 | Tragic 56.2% |
| Barbadians | 1.3 /100 | #238 | Tragic 56.0% |
| Puget Sound Salish | 1.1 /100 | #239 | Tragic 55.9% |
| Trinidadians and Tobagonians | 1.1 /100 | #240 | Tragic 55.8% |
| French American Indians | 1.0 /100 | #241 | Tragic 55.8% |
| Marshallese | 1.0 /100 | #242 | Tragic 55.8% |
| Osage | 1.0 /100 | #243 | Tragic 55.8% |
| Chippewa | 0.9 /100 | #244 | Tragic 55.7% |
| Immigrants | Liberia | 0.8 /100 | #245 | Tragic 55.7% |
Demographics Similar to Laotians by College, 1 year or more
In terms of college, 1 year or more, the demographic groups most similar to Laotians are Immigrants from Bolivia (62.8%, a difference of 0.050%), Lithuanian (62.9%, a difference of 0.060%), Immigrants from Argentina (62.8%, a difference of 0.080%), Northern European (62.9%, a difference of 0.090%), and Immigrants from Lebanon (62.9%, a difference of 0.11%).
| Demographics | Rating | Rank | College, 1 year or more |
| Immigrants | North America | 99.0 /100 | #74 | Exceptional 63.0% |
| Armenians | 98.9 /100 | #75 | Exceptional 63.0% |
| Paraguayans | 98.8 /100 | #76 | Exceptional 62.9% |
| Ethiopians | 98.8 /100 | #77 | Exceptional 62.9% |
| Immigrants | Lebanon | 98.8 /100 | #78 | Exceptional 62.9% |
| Northern Europeans | 98.8 /100 | #79 | Exceptional 62.9% |
| Lithuanians | 98.8 /100 | #80 | Exceptional 62.9% |
| Laotians | 98.7 /100 | #81 | Exceptional 62.8% |
| Immigrants | Bolivia | 98.7 /100 | #82 | Exceptional 62.8% |
| Immigrants | Argentina | 98.6 /100 | #83 | Exceptional 62.8% |
| Immigrants | England | 98.6 /100 | #84 | Exceptional 62.8% |
| Immigrants | Pakistan | 98.6 /100 | #85 | Exceptional 62.8% |
| Immigrants | Western Europe | 98.6 /100 | #86 | Exceptional 62.7% |
| Immigrants | Hungary | 98.6 /100 | #87 | Exceptional 62.7% |
| Greeks | 98.3 /100 | #88 | Exceptional 62.6% |