Barbadian vs Israeli Median Male Earnings
COMPARE
Barbadian
Israeli
Median Male Earnings
Median Male Earnings Comparison
Barbadians
Israelis
$51,236
MEDIAN MALE EARNINGS
3.9/ 100
METRIC RATING
231st/ 347
METRIC RANK
$63,228
MEDIAN MALE EARNINGS
100.0/ 100
METRIC RATING
36th/ 347
METRIC RANK
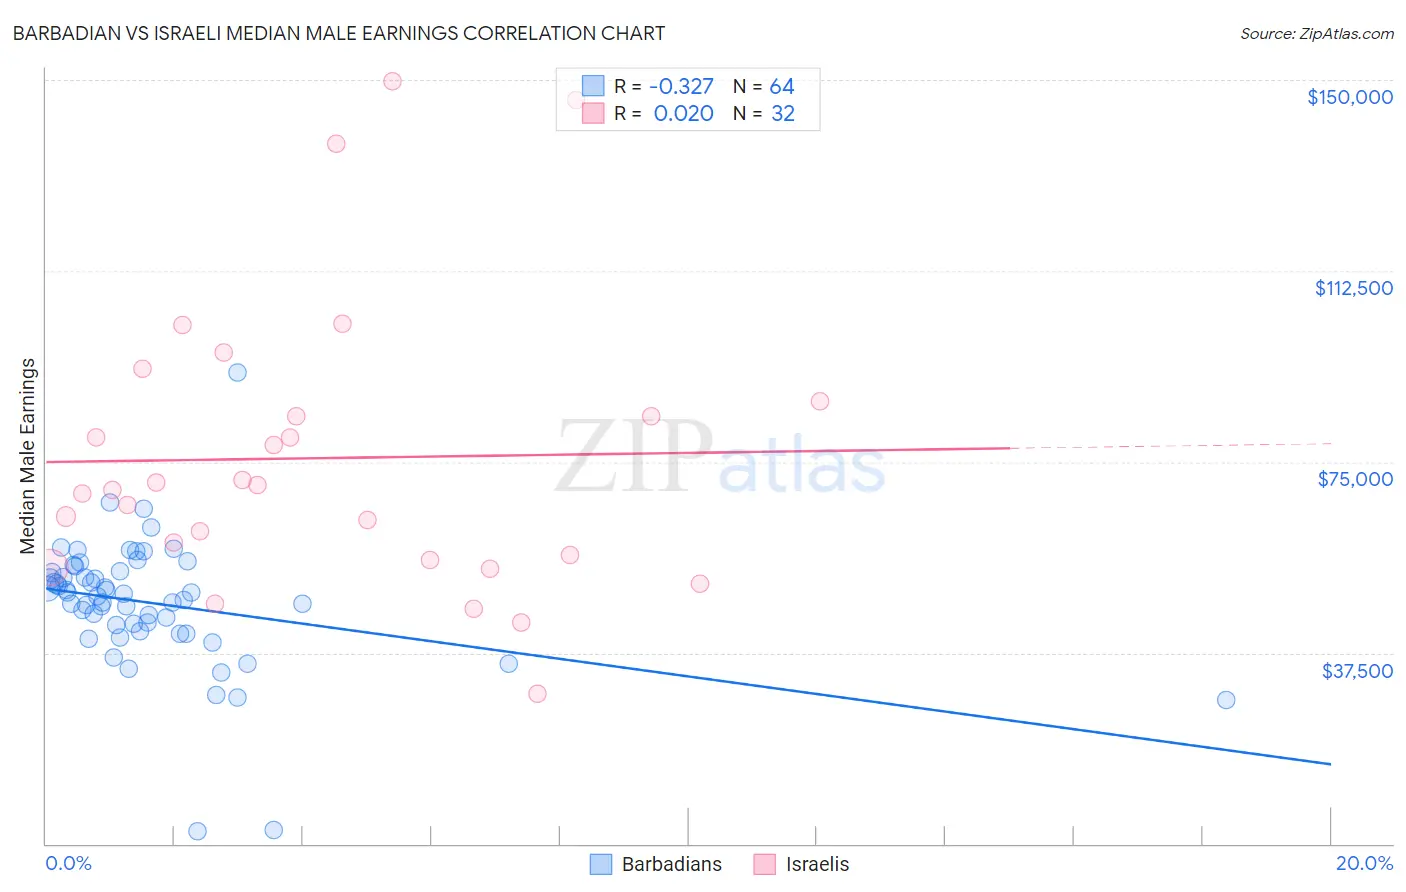
Barbadian vs Israeli Median Male Earnings Correlation Chart
The statistical analysis conducted on geographies consisting of 141,271,676 people shows a mild negative correlation between the proportion of Barbadians and median male earnings in the United States with a correlation coefficient (R) of -0.327 and weighted average of $51,236. Similarly, the statistical analysis conducted on geographies consisting of 211,181,462 people shows no correlation between the proportion of Israelis and median male earnings in the United States with a correlation coefficient (R) of 0.020 and weighted average of $63,228, a difference of 23.4%.
Median Male Earnings Correlation Summary
| Measurement | Barbadian | Israeli |
| Minimum | $2,499 | $29,375 |
| Maximum | $92,582 | $149,778 |
| Range | $90,083 | $120,403 |
| Mean | $47,251 | $75,746 |
| Median | $48,821 | $69,912 |
| Interquartile 25% (IQ1) | $42,256 | $56,213 |
| Interquartile 75% (IQ3) | $53,422 | $85,475 |
| Interquartile Range (IQR) | $11,166 | $29,262 |
| Standard Deviation (Sample) | $12,825 | $28,326 |
| Standard Deviation (Population) | $12,724 | $27,880 |
Similar Demographics by Median Male Earnings
Demographics Similar to Barbadians by Median Male Earnings
In terms of median male earnings, the demographic groups most similar to Barbadians are Sudanese ($51,216, a difference of 0.040%), Aleut ($51,168, a difference of 0.13%), Immigrants from Nigeria ($51,310, a difference of 0.14%), Cape Verdean ($51,103, a difference of 0.26%), and Immigrants from Trinidad and Tobago ($51,376, a difference of 0.27%).
| Demographics | Rating | Rank | Median Male Earnings |
| Immigrants | Cambodia | 5.5 /100 | #224 | Tragic $51,594 |
| Immigrants | Sudan | 5.0 /100 | #225 | Tragic $51,489 |
| Japanese | 4.9 /100 | #226 | Tragic $51,473 |
| Trinidadians and Tobagonians | 4.8 /100 | #227 | Tragic $51,446 |
| Samoans | 4.6 /100 | #228 | Tragic $51,389 |
| Immigrants | Trinidad and Tobago | 4.5 /100 | #229 | Tragic $51,376 |
| Immigrants | Nigeria | 4.2 /100 | #230 | Tragic $51,310 |
| Barbadians | 3.9 /100 | #231 | Tragic $51,236 |
| Sudanese | 3.9 /100 | #232 | Tragic $51,216 |
| Aleuts | 3.7 /100 | #233 | Tragic $51,168 |
| Cape Verdeans | 3.5 /100 | #234 | Tragic $51,103 |
| Immigrants | Western Africa | 3.0 /100 | #235 | Tragic $50,940 |
| Pennsylvania Germans | 2.8 /100 | #236 | Tragic $50,878 |
| Immigrants | Barbados | 2.6 /100 | #237 | Tragic $50,795 |
| Malaysians | 2.5 /100 | #238 | Tragic $50,772 |
Demographics Similar to Israelis by Median Male Earnings
In terms of median male earnings, the demographic groups most similar to Israelis are Immigrants from Asia ($63,240, a difference of 0.020%), Immigrants from Russia ($63,326, a difference of 0.16%), Immigrants from Lithuania ($63,346, a difference of 0.19%), Immigrants from Sri Lanka ($63,099, a difference of 0.20%), and Soviet Union ($63,382, a difference of 0.24%).
| Demographics | Rating | Rank | Median Male Earnings |
| Asians | 100.0 /100 | #29 | Exceptional $63,827 |
| Immigrants | France | 100.0 /100 | #30 | Exceptional $63,715 |
| Latvians | 100.0 /100 | #31 | Exceptional $63,498 |
| Soviet Union | 100.0 /100 | #32 | Exceptional $63,382 |
| Immigrants | Lithuania | 100.0 /100 | #33 | Exceptional $63,346 |
| Immigrants | Russia | 100.0 /100 | #34 | Exceptional $63,326 |
| Immigrants | Asia | 100.0 /100 | #35 | Exceptional $63,240 |
| Israelis | 100.0 /100 | #36 | Exceptional $63,228 |
| Immigrants | Sri Lanka | 100.0 /100 | #37 | Exceptional $63,099 |
| Maltese | 100.0 /100 | #38 | Exceptional $62,953 |
| Immigrants | South Africa | 100.0 /100 | #39 | Exceptional $62,899 |
| Australians | 100.0 /100 | #40 | Exceptional $62,857 |
| Immigrants | Turkey | 100.0 /100 | #41 | Exceptional $62,728 |
| Immigrants | Greece | 100.0 /100 | #42 | Exceptional $62,689 |
| Immigrants | Belarus | 100.0 /100 | #43 | Exceptional $62,658 |