Celtic vs Laotian Median Male Earnings
COMPARE
Celtic
Laotian
Median Male Earnings
Median Male Earnings Comparison
Celtics
Laotians
$54,242
MEDIAN MALE EARNINGS
43.9/ 100
METRIC RATING
179th/ 347
METRIC RANK
$59,351
MEDIAN MALE EARNINGS
99.2/ 100
METRIC RATING
91st/ 347
METRIC RANK
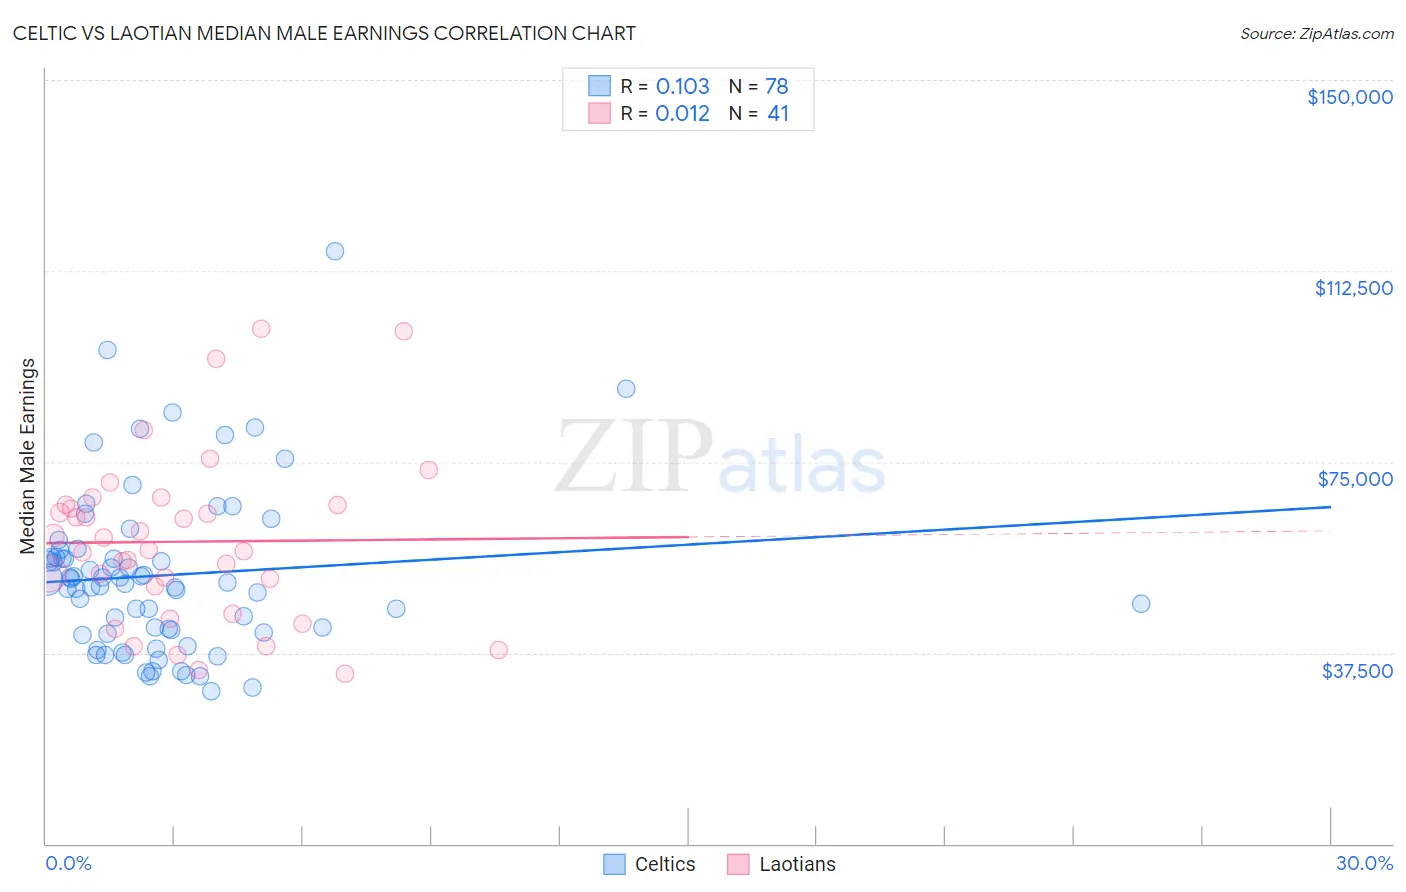
Celtic vs Laotian Median Male Earnings Correlation Chart
The statistical analysis conducted on geographies consisting of 168,835,253 people shows a poor positive correlation between the proportion of Celtics and median male earnings in the United States with a correlation coefficient (R) of 0.103 and weighted average of $54,242. Similarly, the statistical analysis conducted on geographies consisting of 224,845,741 people shows no correlation between the proportion of Laotians and median male earnings in the United States with a correlation coefficient (R) of 0.012 and weighted average of $59,351, a difference of 9.4%.
Median Male Earnings Correlation Summary
| Measurement | Celtic | Laotian |
| Minimum | $30,000 | $33,481 |
| Maximum | $116,250 | $101,250 |
| Range | $86,250 | $67,769 |
| Mean | $52,737 | $59,314 |
| Median | $51,157 | $57,776 |
| Interquartile 25% (IQ1) | $41,563 | $47,781 |
| Interquartile 75% (IQ3) | $56,235 | $66,498 |
| Interquartile Range (IQR) | $14,672 | $18,717 |
| Standard Deviation (Sample) | $16,099 | $16,323 |
| Standard Deviation (Population) | $15,995 | $16,122 |
Similar Demographics by Median Male Earnings
Demographics Similar to Celtics by Median Male Earnings
In terms of median male earnings, the demographic groups most similar to Celtics are Costa Rican ($54,279, a difference of 0.070%), Sierra Leonean ($54,279, a difference of 0.070%), Iraqi ($54,182, a difference of 0.11%), Immigrants ($54,168, a difference of 0.14%), and Spaniard ($54,401, a difference of 0.29%).
| Demographics | Rating | Rank | Median Male Earnings |
| Welsh | 53.8 /100 | #172 | Average $54,647 |
| South American Indians | 50.4 /100 | #173 | Average $54,508 |
| South Americans | 50.0 /100 | #174 | Average $54,492 |
| Dutch | 48.0 /100 | #175 | Average $54,410 |
| Spaniards | 47.8 /100 | #176 | Average $54,401 |
| Costa Ricans | 44.8 /100 | #177 | Average $54,279 |
| Sierra Leoneans | 44.8 /100 | #178 | Average $54,279 |
| Celtics | 43.9 /100 | #179 | Average $54,242 |
| Iraqis | 42.5 /100 | #180 | Average $54,182 |
| Immigrants | Immigrants | 42.1 /100 | #181 | Average $54,168 |
| Yugoslavians | 37.4 /100 | #182 | Fair $53,967 |
| Immigrants | South America | 37.3 /100 | #183 | Fair $53,962 |
| Whites/Caucasians | 36.5 /100 | #184 | Fair $53,925 |
| Immigrants | Sierra Leone | 36.0 /100 | #185 | Fair $53,905 |
| Colombians | 34.4 /100 | #186 | Fair $53,832 |
Demographics Similar to Laotians by Median Male Earnings
In terms of median male earnings, the demographic groups most similar to Laotians are Austrian ($59,359, a difference of 0.010%), Immigrants from Moldova ($59,417, a difference of 0.11%), Immigrants from Kazakhstan ($59,278, a difference of 0.12%), Immigrants from Southern Europe ($59,217, a difference of 0.23%), and Immigrants from Argentina ($59,491, a difference of 0.24%).
| Demographics | Rating | Rank | Median Male Earnings |
| Afghans | 99.3 /100 | #84 | Exceptional $59,554 |
| Italians | 99.3 /100 | #85 | Exceptional $59,551 |
| Immigrants | England | 99.3 /100 | #86 | Exceptional $59,527 |
| Macedonians | 99.3 /100 | #87 | Exceptional $59,522 |
| Immigrants | Argentina | 99.3 /100 | #88 | Exceptional $59,491 |
| Immigrants | Moldova | 99.2 /100 | #89 | Exceptional $59,417 |
| Austrians | 99.2 /100 | #90 | Exceptional $59,359 |
| Laotians | 99.2 /100 | #91 | Exceptional $59,351 |
| Immigrants | Kazakhstan | 99.1 /100 | #92 | Exceptional $59,278 |
| Immigrants | Southern Europe | 99.0 /100 | #93 | Exceptional $59,217 |
| Immigrants | North Macedonia | 99.0 /100 | #94 | Exceptional $59,189 |
| Immigrants | Lebanon | 98.6 /100 | #95 | Exceptional $58,835 |
| Albanians | 98.4 /100 | #96 | Exceptional $58,680 |
| Northern Europeans | 98.2 /100 | #97 | Exceptional $58,588 |
| Jordanians | 98.1 /100 | #98 | Exceptional $58,500 |