Ottawa vs Laotian Median Male Earnings
COMPARE
Ottawa
Laotian
Median Male Earnings
Median Male Earnings Comparison
Ottawa
Laotians
$46,611
MEDIAN MALE EARNINGS
0.0/ 100
METRIC RATING
308th/ 347
METRIC RANK
$59,351
MEDIAN MALE EARNINGS
99.2/ 100
METRIC RATING
91st/ 347
METRIC RANK
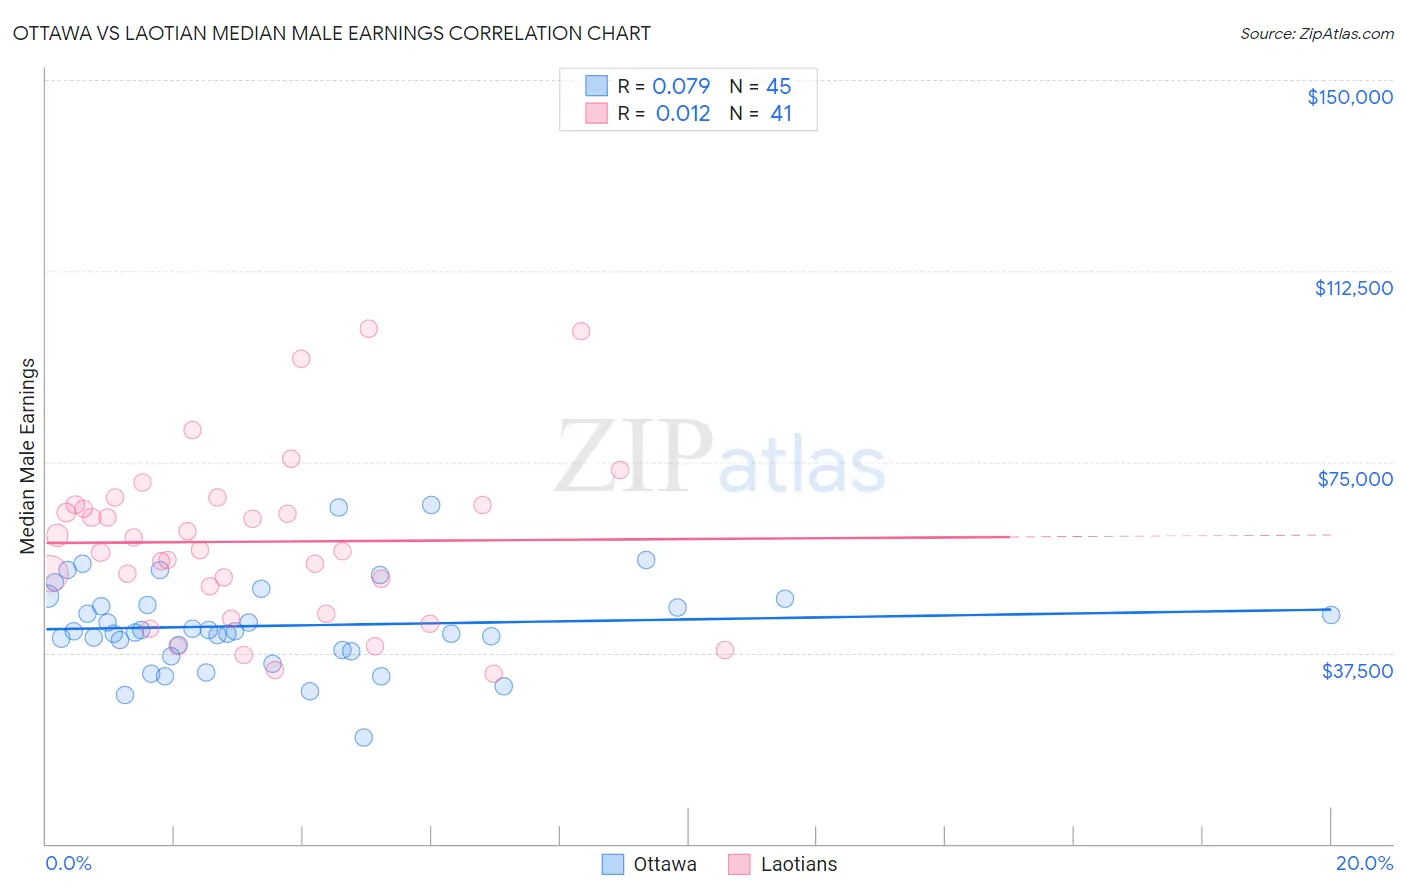
Ottawa vs Laotian Median Male Earnings Correlation Chart
The statistical analysis conducted on geographies consisting of 49,954,818 people shows a slight positive correlation between the proportion of Ottawa and median male earnings in the United States with a correlation coefficient (R) of 0.079 and weighted average of $46,611. Similarly, the statistical analysis conducted on geographies consisting of 224,845,741 people shows no correlation between the proportion of Laotians and median male earnings in the United States with a correlation coefficient (R) of 0.012 and weighted average of $59,351, a difference of 27.3%.
Median Male Earnings Correlation Summary
| Measurement | Ottawa | Laotian |
| Minimum | $20,938 | $33,481 |
| Maximum | $66,563 | $101,250 |
| Range | $45,625 | $67,769 |
| Mean | $42,823 | $59,314 |
| Median | $41,768 | $57,776 |
| Interquartile 25% (IQ1) | $37,908 | $47,781 |
| Interquartile 75% (IQ3) | $47,441 | $66,498 |
| Interquartile Range (IQR) | $9,533 | $18,717 |
| Standard Deviation (Sample) | $8,970 | $16,323 |
| Standard Deviation (Population) | $8,870 | $16,122 |
Similar Demographics by Median Male Earnings
Demographics Similar to Ottawa by Median Male Earnings
In terms of median male earnings, the demographic groups most similar to Ottawa are Creek ($46,594, a difference of 0.040%), Cuban ($46,580, a difference of 0.070%), Immigrants from Dominican Republic ($46,655, a difference of 0.090%), Dutch West Indian ($46,656, a difference of 0.10%), and Guatemalan ($46,736, a difference of 0.27%).
| Demographics | Rating | Rank | Median Male Earnings |
| Immigrants | Latin America | 0.1 /100 | #301 | Tragic $46,941 |
| Seminole | 0.1 /100 | #302 | Tragic $46,783 |
| Yaqui | 0.1 /100 | #303 | Tragic $46,777 |
| Bangladeshis | 0.1 /100 | #304 | Tragic $46,744 |
| Guatemalans | 0.0 /100 | #305 | Tragic $46,736 |
| Dutch West Indians | 0.0 /100 | #306 | Tragic $46,656 |
| Immigrants | Dominican Republic | 0.0 /100 | #307 | Tragic $46,655 |
| Ottawa | 0.0 /100 | #308 | Tragic $46,611 |
| Creek | 0.0 /100 | #309 | Tragic $46,594 |
| Cubans | 0.0 /100 | #310 | Tragic $46,580 |
| Apache | 0.0 /100 | #311 | Tragic $46,429 |
| Hispanics or Latinos | 0.0 /100 | #312 | Tragic $46,419 |
| Hondurans | 0.0 /100 | #313 | Tragic $46,374 |
| Chippewa | 0.0 /100 | #314 | Tragic $46,368 |
| Immigrants | Guatemala | 0.0 /100 | #315 | Tragic $46,244 |
Demographics Similar to Laotians by Median Male Earnings
In terms of median male earnings, the demographic groups most similar to Laotians are Austrian ($59,359, a difference of 0.010%), Immigrants from Moldova ($59,417, a difference of 0.11%), Immigrants from Kazakhstan ($59,278, a difference of 0.12%), Immigrants from Southern Europe ($59,217, a difference of 0.23%), and Immigrants from Argentina ($59,491, a difference of 0.24%).
| Demographics | Rating | Rank | Median Male Earnings |
| Afghans | 99.3 /100 | #84 | Exceptional $59,554 |
| Italians | 99.3 /100 | #85 | Exceptional $59,551 |
| Immigrants | England | 99.3 /100 | #86 | Exceptional $59,527 |
| Macedonians | 99.3 /100 | #87 | Exceptional $59,522 |
| Immigrants | Argentina | 99.3 /100 | #88 | Exceptional $59,491 |
| Immigrants | Moldova | 99.2 /100 | #89 | Exceptional $59,417 |
| Austrians | 99.2 /100 | #90 | Exceptional $59,359 |
| Laotians | 99.2 /100 | #91 | Exceptional $59,351 |
| Immigrants | Kazakhstan | 99.1 /100 | #92 | Exceptional $59,278 |
| Immigrants | Southern Europe | 99.0 /100 | #93 | Exceptional $59,217 |
| Immigrants | North Macedonia | 99.0 /100 | #94 | Exceptional $59,189 |
| Immigrants | Lebanon | 98.6 /100 | #95 | Exceptional $58,835 |
| Albanians | 98.4 /100 | #96 | Exceptional $58,680 |
| Northern Europeans | 98.2 /100 | #97 | Exceptional $58,588 |
| Jordanians | 98.1 /100 | #98 | Exceptional $58,500 |