Mongolian vs Laotian Median Male Earnings
COMPARE
Mongolian
Laotian
Median Male Earnings
Median Male Earnings Comparison
Mongolians
Laotians
$60,350
MEDIAN MALE EARNINGS
99.7/ 100
METRIC RATING
71st/ 347
METRIC RANK
$59,351
MEDIAN MALE EARNINGS
99.2/ 100
METRIC RATING
91st/ 347
METRIC RANK
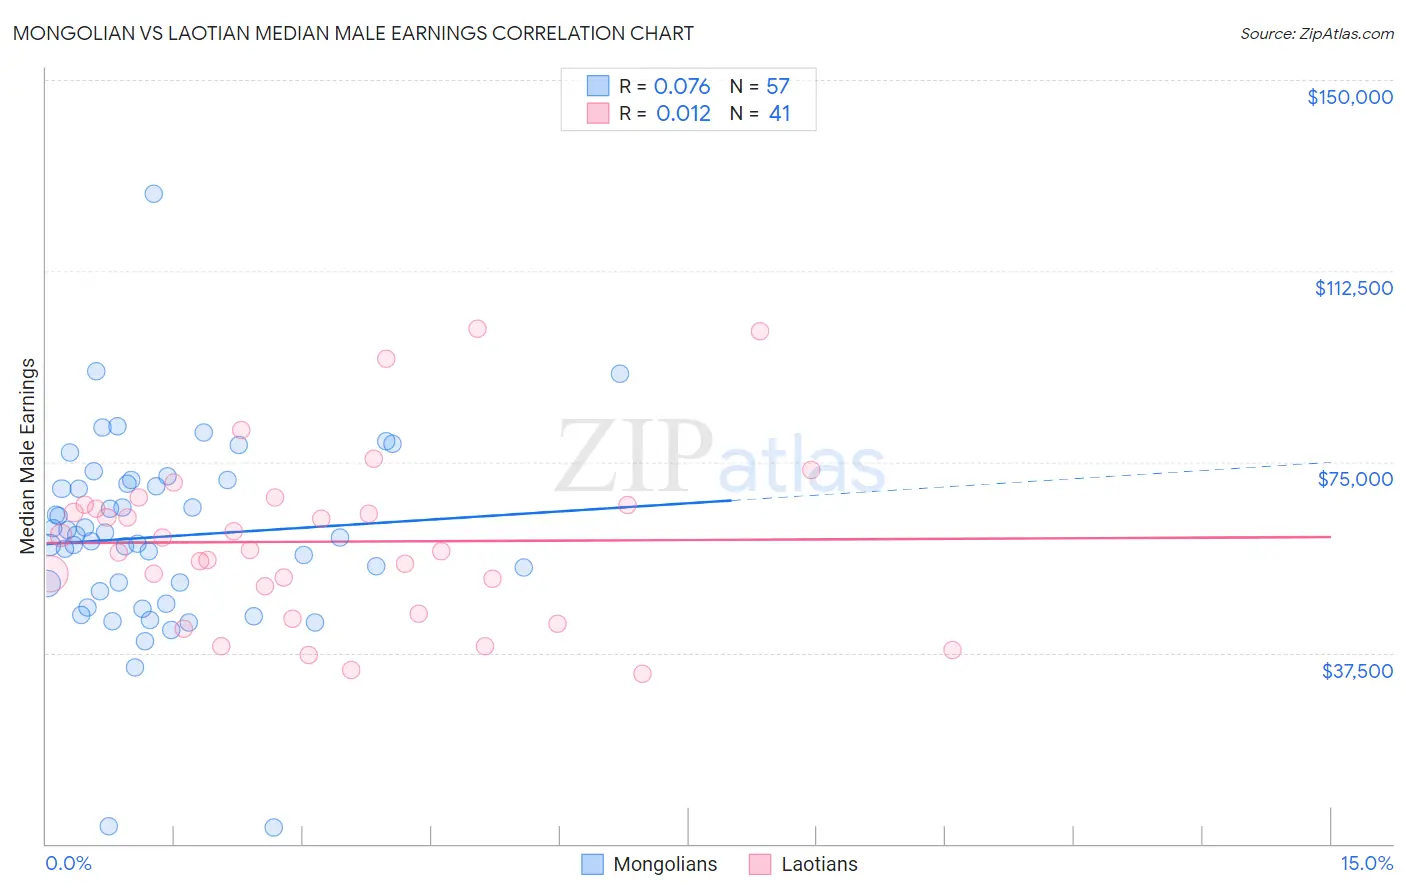
Mongolian vs Laotian Median Male Earnings Correlation Chart
The statistical analysis conducted on geographies consisting of 140,336,104 people shows a slight positive correlation between the proportion of Mongolians and median male earnings in the United States with a correlation coefficient (R) of 0.076 and weighted average of $60,350. Similarly, the statistical analysis conducted on geographies consisting of 224,845,741 people shows no correlation between the proportion of Laotians and median male earnings in the United States with a correlation coefficient (R) of 0.012 and weighted average of $59,351, a difference of 1.7%.
Median Male Earnings Correlation Summary
| Measurement | Mongolian | Laotian |
| Minimum | $3,109 | $33,481 |
| Maximum | $127,545 | $101,250 |
| Range | $124,436 | $67,769 |
| Mean | $60,323 | $59,314 |
| Median | $60,102 | $57,776 |
| Interquartile 25% (IQ1) | $48,308 | $47,781 |
| Interquartile 75% (IQ3) | $71,104 | $66,498 |
| Interquartile Range (IQR) | $22,796 | $18,717 |
| Standard Deviation (Sample) | $19,294 | $16,323 |
| Standard Deviation (Population) | $19,124 | $16,122 |
Demographics Similar to Mongolians and Laotians by Median Male Earnings
In terms of median male earnings, the demographic groups most similar to Mongolians are Immigrants from Western Europe ($60,334, a difference of 0.030%), Immigrants from North America ($60,265, a difference of 0.14%), Argentinean ($60,117, a difference of 0.39%), Immigrants from Bolivia ($60,088, a difference of 0.44%), and Romanian ($60,063, a difference of 0.48%). Similarly, the demographic groups most similar to Laotians are Austrian ($59,359, a difference of 0.010%), Immigrants from Moldova ($59,417, a difference of 0.11%), Immigrants from Argentina ($59,491, a difference of 0.24%), Macedonian ($59,522, a difference of 0.29%), and Immigrants from England ($59,527, a difference of 0.30%).
| Demographics | Rating | Rank | Median Male Earnings |
| Mongolians | 99.7 /100 | #71 | Exceptional $60,350 |
| Immigrants | Western Europe | 99.7 /100 | #72 | Exceptional $60,334 |
| Immigrants | North America | 99.7 /100 | #73 | Exceptional $60,265 |
| Argentineans | 99.6 /100 | #74 | Exceptional $60,117 |
| Immigrants | Bolivia | 99.6 /100 | #75 | Exceptional $60,088 |
| Romanians | 99.6 /100 | #76 | Exceptional $60,063 |
| Paraguayans | 99.5 /100 | #77 | Exceptional $59,975 |
| Immigrants | Egypt | 99.5 /100 | #78 | Exceptional $59,925 |
| Immigrants | Ukraine | 99.5 /100 | #79 | Exceptional $59,820 |
| Immigrants | Hungary | 99.5 /100 | #80 | Exceptional $59,806 |
| Ukrainians | 99.4 /100 | #81 | Exceptional $59,728 |
| Croatians | 99.4 /100 | #82 | Exceptional $59,715 |
| Immigrants | Italy | 99.4 /100 | #83 | Exceptional $59,691 |
| Afghans | 99.3 /100 | #84 | Exceptional $59,554 |
| Italians | 99.3 /100 | #85 | Exceptional $59,551 |
| Immigrants | England | 99.3 /100 | #86 | Exceptional $59,527 |
| Macedonians | 99.3 /100 | #87 | Exceptional $59,522 |
| Immigrants | Argentina | 99.3 /100 | #88 | Exceptional $59,491 |
| Immigrants | Moldova | 99.2 /100 | #89 | Exceptional $59,417 |
| Austrians | 99.2 /100 | #90 | Exceptional $59,359 |
| Laotians | 99.2 /100 | #91 | Exceptional $59,351 |