Bahamian vs Paraguayan Median Male Earnings
COMPARE
Bahamian
Paraguayan
Median Male Earnings
Median Male Earnings Comparison
Bahamians
Paraguayans
$44,756
MEDIAN MALE EARNINGS
0.0/ 100
METRIC RATING
332nd/ 347
METRIC RANK
$59,975
MEDIAN MALE EARNINGS
99.5/ 100
METRIC RATING
77th/ 347
METRIC RANK
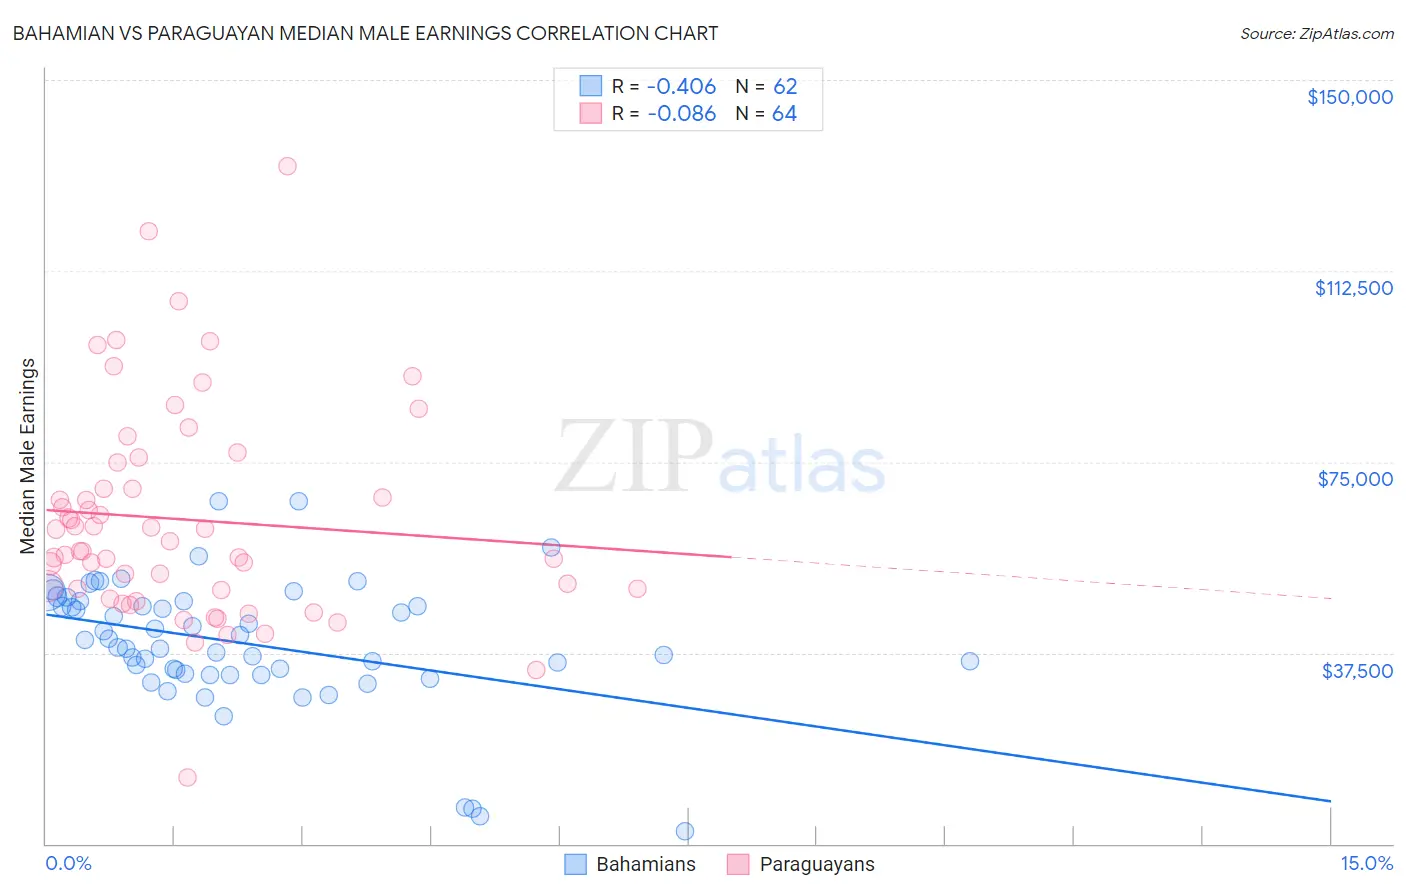
Bahamian vs Paraguayan Median Male Earnings Correlation Chart
The statistical analysis conducted on geographies consisting of 112,679,918 people shows a moderate negative correlation between the proportion of Bahamians and median male earnings in the United States with a correlation coefficient (R) of -0.406 and weighted average of $44,756. Similarly, the statistical analysis conducted on geographies consisting of 95,078,142 people shows a slight negative correlation between the proportion of Paraguayans and median male earnings in the United States with a correlation coefficient (R) of -0.086 and weighted average of $59,975, a difference of 34.0%.
Median Male Earnings Correlation Summary
| Measurement | Bahamian | Paraguayan |
| Minimum | $2,499 | $13,000 |
| Maximum | $67,317 | $133,125 |
| Range | $64,818 | $120,125 |
| Mean | $39,425 | $63,648 |
| Median | $39,316 | $58,508 |
| Interquartile 25% (IQ1) | $33,442 | $49,873 |
| Interquartile 75% (IQ3) | $47,537 | $72,390 |
| Interquartile Range (IQR) | $14,095 | $22,517 |
| Standard Deviation (Sample) | $12,607 | $21,137 |
| Standard Deviation (Population) | $12,505 | $20,971 |
Similar Demographics by Median Male Earnings
Demographics Similar to Bahamians by Median Male Earnings
In terms of median male earnings, the demographic groups most similar to Bahamians are Native/Alaskan ($44,775, a difference of 0.040%), Immigrants from Mexico ($44,960, a difference of 0.46%), Yakama ($45,002, a difference of 0.55%), Kiowa ($45,094, a difference of 0.76%), and Immigrants from Bahamas ($45,176, a difference of 0.94%).
| Demographics | Rating | Rank | Median Male Earnings |
| Yuman | 0.0 /100 | #325 | Tragic $45,446 |
| Immigrants | Haiti | 0.0 /100 | #326 | Tragic $45,266 |
| Immigrants | Bahamas | 0.0 /100 | #327 | Tragic $45,176 |
| Kiowa | 0.0 /100 | #328 | Tragic $45,094 |
| Yakama | 0.0 /100 | #329 | Tragic $45,002 |
| Immigrants | Mexico | 0.0 /100 | #330 | Tragic $44,960 |
| Natives/Alaskans | 0.0 /100 | #331 | Tragic $44,775 |
| Bahamians | 0.0 /100 | #332 | Tragic $44,756 |
| Immigrants | Congo | 0.0 /100 | #333 | Tragic $44,204 |
| Immigrants | Yemen | 0.0 /100 | #334 | Tragic $44,083 |
| Spanish American Indians | 0.0 /100 | #335 | Tragic $44,010 |
| Immigrants | Cuba | 0.0 /100 | #336 | Tragic $43,461 |
| Menominee | 0.0 /100 | #337 | Tragic $42,581 |
| Crow | 0.0 /100 | #338 | Tragic $42,434 |
| Pima | 0.0 /100 | #339 | Tragic $42,357 |
Demographics Similar to Paraguayans by Median Male Earnings
In terms of median male earnings, the demographic groups most similar to Paraguayans are Immigrants from Egypt ($59,925, a difference of 0.080%), Romanian ($60,063, a difference of 0.15%), Immigrants from Bolivia ($60,088, a difference of 0.19%), Argentinean ($60,117, a difference of 0.24%), and Immigrants from Ukraine ($59,820, a difference of 0.26%).
| Demographics | Rating | Rank | Median Male Earnings |
| Immigrants | Bulgaria | 99.7 /100 | #70 | Exceptional $60,358 |
| Mongolians | 99.7 /100 | #71 | Exceptional $60,350 |
| Immigrants | Western Europe | 99.7 /100 | #72 | Exceptional $60,334 |
| Immigrants | North America | 99.7 /100 | #73 | Exceptional $60,265 |
| Argentineans | 99.6 /100 | #74 | Exceptional $60,117 |
| Immigrants | Bolivia | 99.6 /100 | #75 | Exceptional $60,088 |
| Romanians | 99.6 /100 | #76 | Exceptional $60,063 |
| Paraguayans | 99.5 /100 | #77 | Exceptional $59,975 |
| Immigrants | Egypt | 99.5 /100 | #78 | Exceptional $59,925 |
| Immigrants | Ukraine | 99.5 /100 | #79 | Exceptional $59,820 |
| Immigrants | Hungary | 99.5 /100 | #80 | Exceptional $59,806 |
| Ukrainians | 99.4 /100 | #81 | Exceptional $59,728 |
| Croatians | 99.4 /100 | #82 | Exceptional $59,715 |
| Immigrants | Italy | 99.4 /100 | #83 | Exceptional $59,691 |
| Afghans | 99.3 /100 | #84 | Exceptional $59,554 |