Bahamian vs Immigrants from Dominica Median Male Earnings
COMPARE
Bahamian
Immigrants from Dominica
Median Male Earnings
Median Male Earnings Comparison
Bahamians
Immigrants from Dominica
$44,756
MEDIAN MALE EARNINGS
0.0/ 100
METRIC RATING
332nd/ 347
METRIC RANK
$47,651
MEDIAN MALE EARNINGS
0.1/ 100
METRIC RATING
292nd/ 347
METRIC RANK
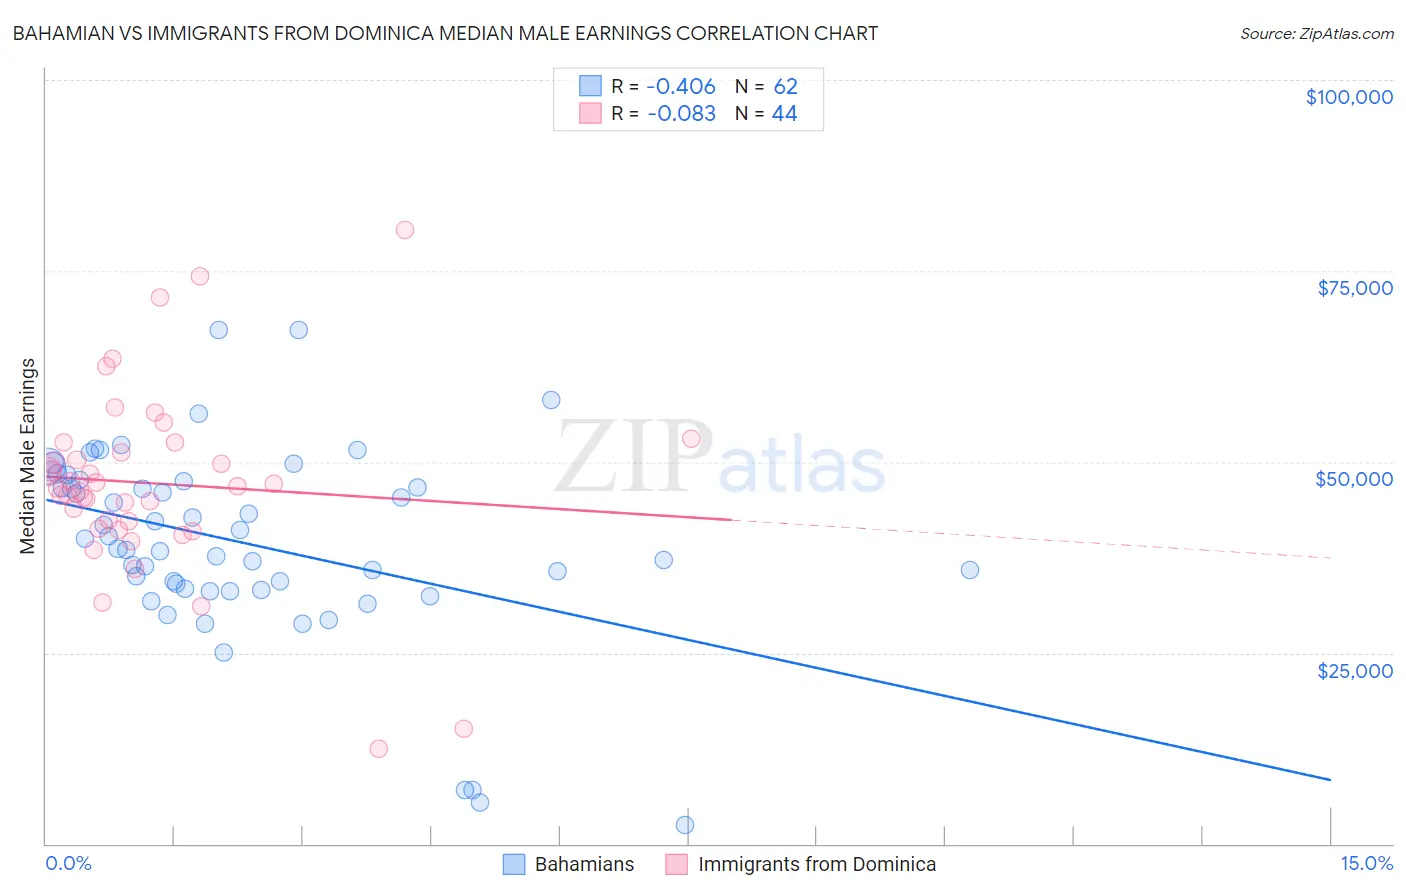
Bahamian vs Immigrants from Dominica Median Male Earnings Correlation Chart
The statistical analysis conducted on geographies consisting of 112,679,918 people shows a moderate negative correlation between the proportion of Bahamians and median male earnings in the United States with a correlation coefficient (R) of -0.406 and weighted average of $44,756. Similarly, the statistical analysis conducted on geographies consisting of 83,786,748 people shows a slight negative correlation between the proportion of Immigrants from Dominica and median male earnings in the United States with a correlation coefficient (R) of -0.083 and weighted average of $47,651, a difference of 6.5%.
Median Male Earnings Correlation Summary
| Measurement | Bahamian | Immigrants from Dominica |
| Minimum | $2,499 | $12,476 |
| Maximum | $67,317 | $80,370 |
| Range | $64,818 | $67,894 |
| Mean | $39,425 | $47,178 |
| Median | $39,316 | $46,677 |
| Interquartile 25% (IQ1) | $33,442 | $41,694 |
| Interquartile 75% (IQ3) | $47,537 | $51,930 |
| Interquartile Range (IQR) | $14,095 | $10,236 |
| Standard Deviation (Sample) | $12,607 | $12,354 |
| Standard Deviation (Population) | $12,505 | $12,213 |
Similar Demographics by Median Male Earnings
Demographics Similar to Bahamians by Median Male Earnings
In terms of median male earnings, the demographic groups most similar to Bahamians are Native/Alaskan ($44,775, a difference of 0.040%), Immigrants from Mexico ($44,960, a difference of 0.46%), Yakama ($45,002, a difference of 0.55%), Kiowa ($45,094, a difference of 0.76%), and Immigrants from Bahamas ($45,176, a difference of 0.94%).
| Demographics | Rating | Rank | Median Male Earnings |
| Yuman | 0.0 /100 | #325 | Tragic $45,446 |
| Immigrants | Haiti | 0.0 /100 | #326 | Tragic $45,266 |
| Immigrants | Bahamas | 0.0 /100 | #327 | Tragic $45,176 |
| Kiowa | 0.0 /100 | #328 | Tragic $45,094 |
| Yakama | 0.0 /100 | #329 | Tragic $45,002 |
| Immigrants | Mexico | 0.0 /100 | #330 | Tragic $44,960 |
| Natives/Alaskans | 0.0 /100 | #331 | Tragic $44,775 |
| Bahamians | 0.0 /100 | #332 | Tragic $44,756 |
| Immigrants | Congo | 0.0 /100 | #333 | Tragic $44,204 |
| Immigrants | Yemen | 0.0 /100 | #334 | Tragic $44,083 |
| Spanish American Indians | 0.0 /100 | #335 | Tragic $44,010 |
| Immigrants | Cuba | 0.0 /100 | #336 | Tragic $43,461 |
| Menominee | 0.0 /100 | #337 | Tragic $42,581 |
| Crow | 0.0 /100 | #338 | Tragic $42,434 |
| Pima | 0.0 /100 | #339 | Tragic $42,357 |
Demographics Similar to Immigrants from Dominica by Median Male Earnings
In terms of median male earnings, the demographic groups most similar to Immigrants from Dominica are Choctaw ($47,729, a difference of 0.16%), Indonesian ($47,503, a difference of 0.31%), Immigrants from Belize ($47,809, a difference of 0.33%), Immigrants from Nicaragua ($47,482, a difference of 0.36%), and Chickasaw ($47,832, a difference of 0.38%).
| Demographics | Rating | Rank | Median Male Earnings |
| Paiute | 0.2 /100 | #285 | Tragic $47,991 |
| Mexican American Indians | 0.2 /100 | #286 | Tragic $47,990 |
| Immigrants | El Salvador | 0.2 /100 | #287 | Tragic $47,973 |
| Shoshone | 0.2 /100 | #288 | Tragic $47,930 |
| Chickasaw | 0.1 /100 | #289 | Tragic $47,832 |
| Immigrants | Belize | 0.1 /100 | #290 | Tragic $47,809 |
| Choctaw | 0.1 /100 | #291 | Tragic $47,729 |
| Immigrants | Dominica | 0.1 /100 | #292 | Tragic $47,651 |
| Indonesians | 0.1 /100 | #293 | Tragic $47,503 |
| Immigrants | Nicaragua | 0.1 /100 | #294 | Tragic $47,482 |
| Central American Indians | 0.1 /100 | #295 | Tragic $47,433 |
| Inupiat | 0.1 /100 | #296 | Tragic $47,281 |
| Dominicans | 0.1 /100 | #297 | Tragic $47,204 |
| Immigrants | Micronesia | 0.1 /100 | #298 | Tragic $47,177 |
| Immigrants | Zaire | 0.1 /100 | #299 | Tragic $47,070 |